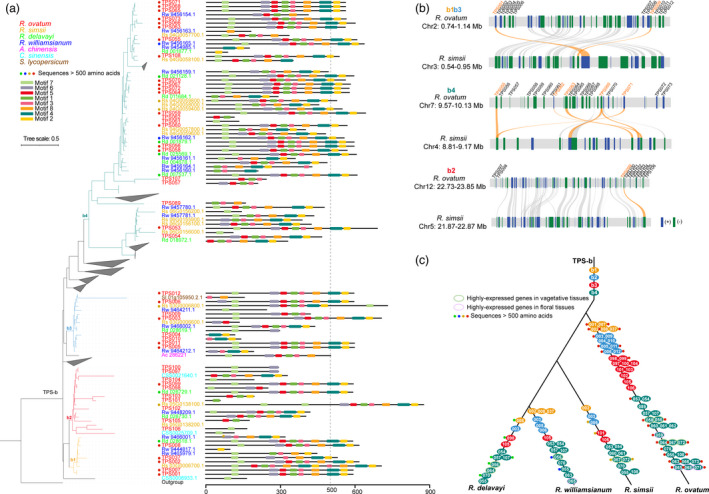
Figure 6.

Evolution of TPS‐b genes in Rhododendron species. (a) Phylogeny tree of TPS‐b subfamily identified in R. ovatum and 6 other sequenced plant genomes. The b1˜4 indicate four groups of Rhododendron TPS‐b. Motifs were predicted using MEME tool (http://meme‐suite.org/tools/meme). The length of 500 amino acids was used to define relatively complete sequences. (b) Intergenomic synteny blocks of the TPS‐b‐located chromosome regions of R. ovatum and R. simsii. TPS‐b gene names of R. ovatum were marked above the gene blocks and the lines link the syntenic TPS‐b genes are highlighted in orange. (c) Schematic drawing of the evolution history of TPS‐b aligned with the lineage phylogeny of R. ovatum, R. simsii, R. williamsianum, and R. delavayi. The black lines indicate the lineage phylogeny of the four Rhododendron species. The TPS‐b orthologues are aligned in the branches according to the phylogeny relationships. The complete sequences and the highly expressed genes in vegetative or floral tissues were marked.
