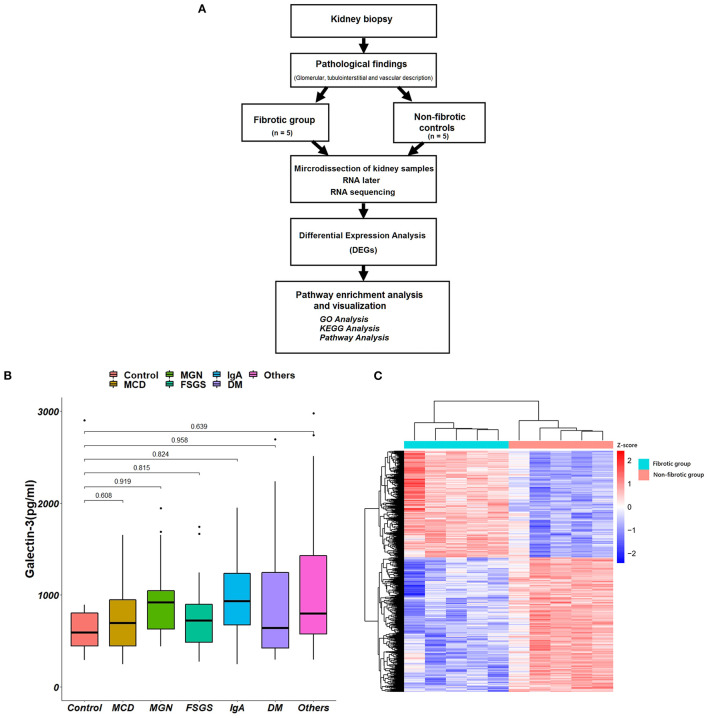
Figure 3.
Kidney biopsy specimens for pathology and RNA sequencing analysis. (A) The algorithm of the collections of kidney biopsy specimens. (B) The associations between different pathological diagnoses and plasma Gal-3 levels. (C) The hierarchical clustering heat map shows the expression of different genes between fibrotic groups and non-fibrotic controls. Gal-3, galectin-3; GO, Gene Ontology; KEGG, Kyoto Encyclopedia of Genes and Genomes; MCD, minimal change disease; FSGS, focal segmental glomerulosclerosis; IgA, immunoglobulin A; DM, diabetes mellitus.

