Figure 1.
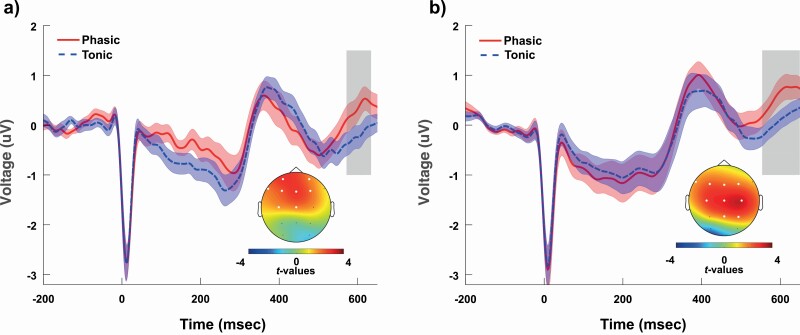
HEP (heartbeat evoked potential) waveform during phasic and tonic REM sleep in Study 1 (A) and Study 2 (B). HEP amplitudes differed at a trend level in Study 1 (cluster level p = 0.0442 between 571.5 and 634 ms) and showed significant differences in Study 2 (cluster level p = 0.006 between 553.9 and 649.6 ms). Clusters in time and space were extracted and corrected for multiple comparisons by cluster-based permutation statistics (Maris and Oostenveld, 2007). The headplots illustrate the channel locations that formed the clusters within the time range shaded by gray rectangles. The lineplots indicate the HEP waveforms and standard errors averaged across the channels that belonged to the clusters.

