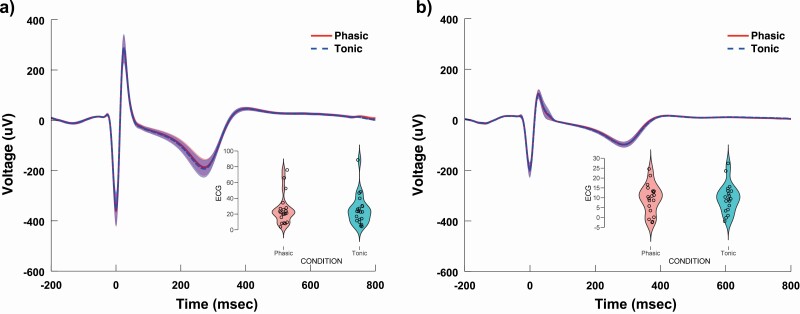
Figure 2.
ECG amplitudes in phasic and tonic REM in Study 1 (A) and Study 2 (B). ECG waveforms were homogeneous across REM microstates, and were not associated with differences in HEPs across phasic and tonic conditions (see Sections 3.2 and 3.3). Violin plots on the right lower corner show the distribution of ECG amplitudes averaged over the time range of the positive cluster where HEP amplitudes were different across phasic and tonic REM.

