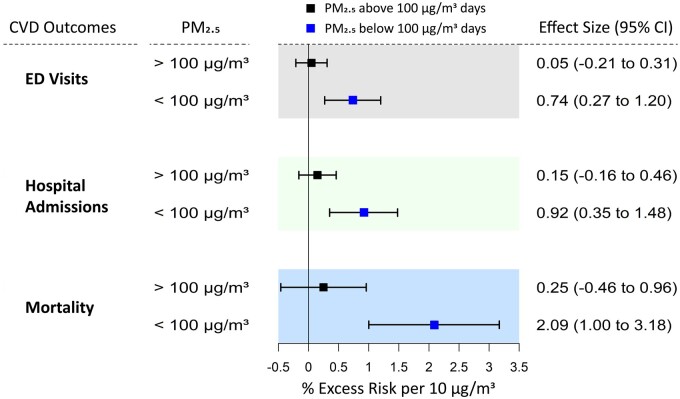
Figure 3.
Comparison of the effect sizes per 10 µg/m3 increase in PM2.5 mass concentration with all three cardiovascular health outcomes during all year, when PM2.5 was <100 µg/m3 (total 1019 days), and when PM2.5 was >100 µg/m3 (total 564 days). PM2.5 associations with emergency department visits and hospital admissions were at lag-0, and with mortality was at lag-1. The model was adjusted for long-term trends and seasonality, day-of-week, Ramadan, blockade days, holidays and the effect of temperature and relative humidity. CVD, cardiovascular disease; ED, emergency department; PM2.5, fine particulate matter with an aerodynamic diameter of ≤2.5 µm.

