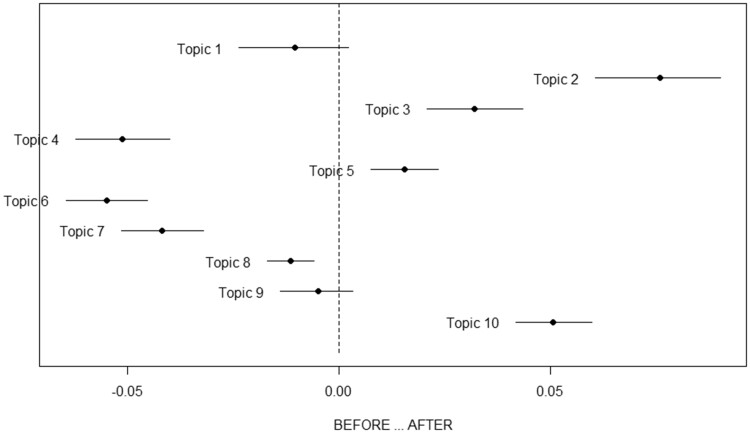
Figure 5.
Analysis of changes in the prevalence of topics in the pre–COVID-19 (coronavirus disease 2019) period and COVID-19 period datasets. The scale on the vertical axis is irrelevant; it simply lists the topics in order. The horizontal axis shows the size of the incremental effect (positive for topics on the right-hand side of the graph and negative on the left-hand side of the graph) of an indicator variable (1 = COVID-19, 0 = pre–COVID-19) on the prevalence of the corresponding topic.

