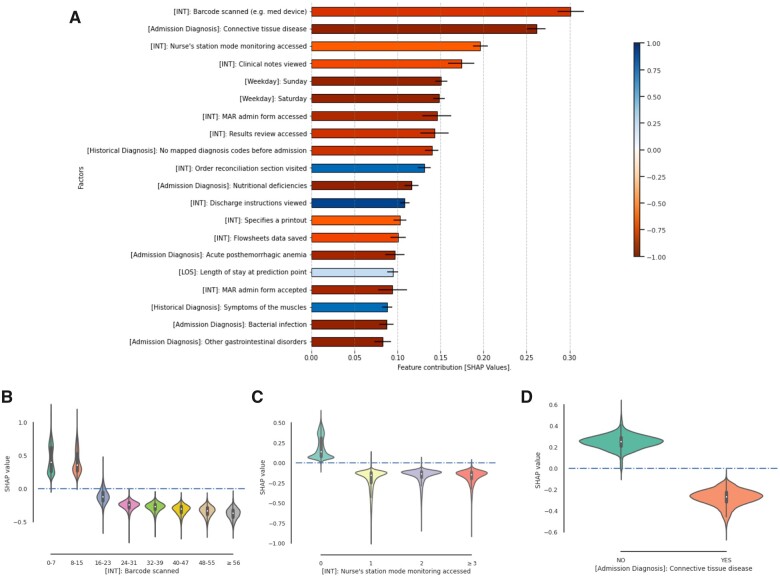
Figure 6.
Feature importance in the next-day discharge prediction model. (A) Top risk factors indicated by SHAP values. The color of each bar indicates the Pearson correlation coefficient between SHAP values and values of the corresponding factor. (B–D) Violin plots of factor values against the corresponding SHAP values on 3 factors: [INT] Barcode scanned, [INT] Nurse’s station mode monitoring accessed, and [Admission Diagnosis]: Connective tissue disease. MAR: medication administration record; SHAP: SHapley Additive exPlanations.

