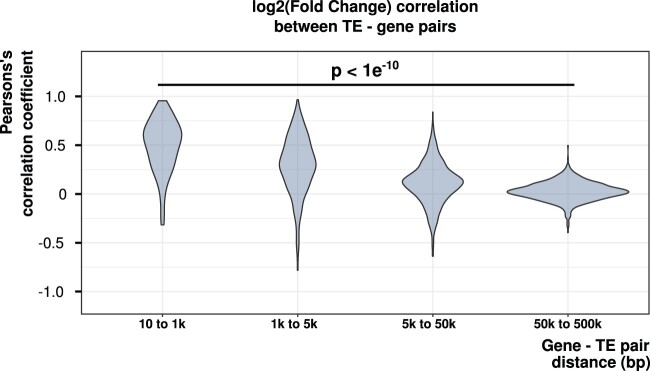
Fig. 4.
Correlation coefficients calculated on expression bias between adjacent genes and TE copies for different intervening distances, for each TE family. Each violin corresponds to the distribution of correlation coefficients of the different TE families. Fewer gene–TE pairs are found for the shortest distance categories, explaining why the variance is higher for these categories. The closer TEs and genes are located, the higher the correlation coefficient of expression bias between genes and TEs.

