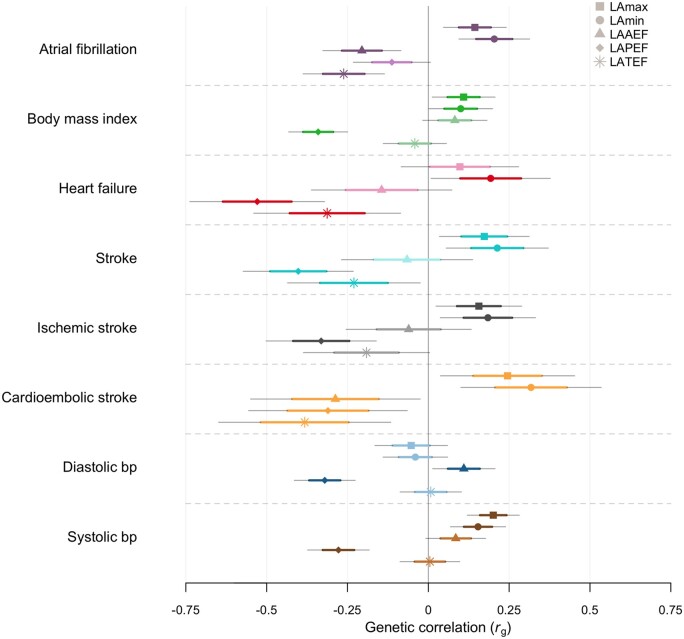
Figure 3.
Genetic correlation between left atrial traits and cardiovascular phenotypes using LDSC. Sample sizes of external genome-wide association studies are shown in Supplementary material online, Data S2. Phenotypes with negative log10(P) are displayed on the y-axis. X-axis shows genetic correlation (rg). Point estimates shown as dots with thick lines indicate mean and standard error (SE) and thin lines 95% confidence intervals (1.96xSE). Nominal significance (P < 0.05) is denoted with bright colour and non-significant correlations with faded colour. Standard errors and P-values were derived using block jackknife resampling.

