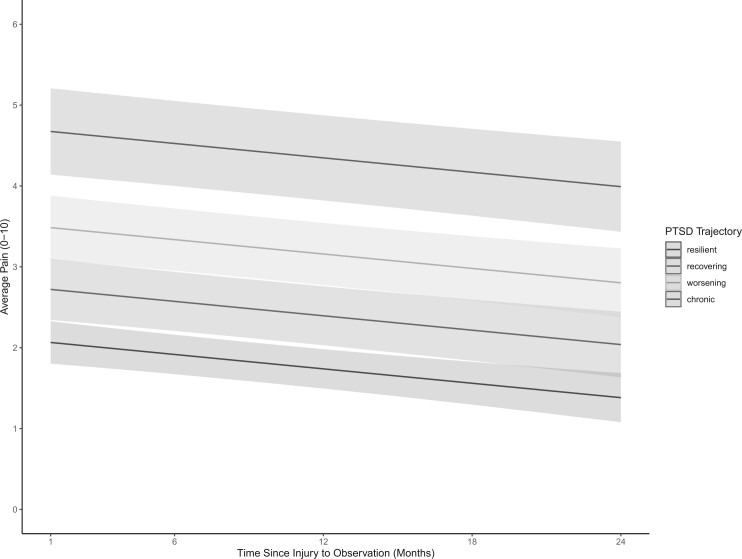
Figure 2.
Plotted linear mixed effects model coefficients estimating Brief Pain Inventory Average Pain from 1 to 24 months after injury. A differential pain response is observed based on PTSD symptom trajectories. Individuals presenting with chronic PTSD symptom trajectories (red line) are estimated to experience average pain 2.61 points higher compared to those on a resilient trajectory (green line) (95% CI: 1.71, 3.14). Individuals presenting with a worsening PTSD symptom trajectory (yellow line) are estimated to experience average pain scores 1.42 points higher than participants presenting with resilient PTSD trajectories (95% CI: 0.77, 1.78). Individuals experiencing a recovering PTSD trajectory (blue line) were associated with average pain scores 0.65 points higher than those with resilient trajectories (95% CI 0.09, 1.08).

