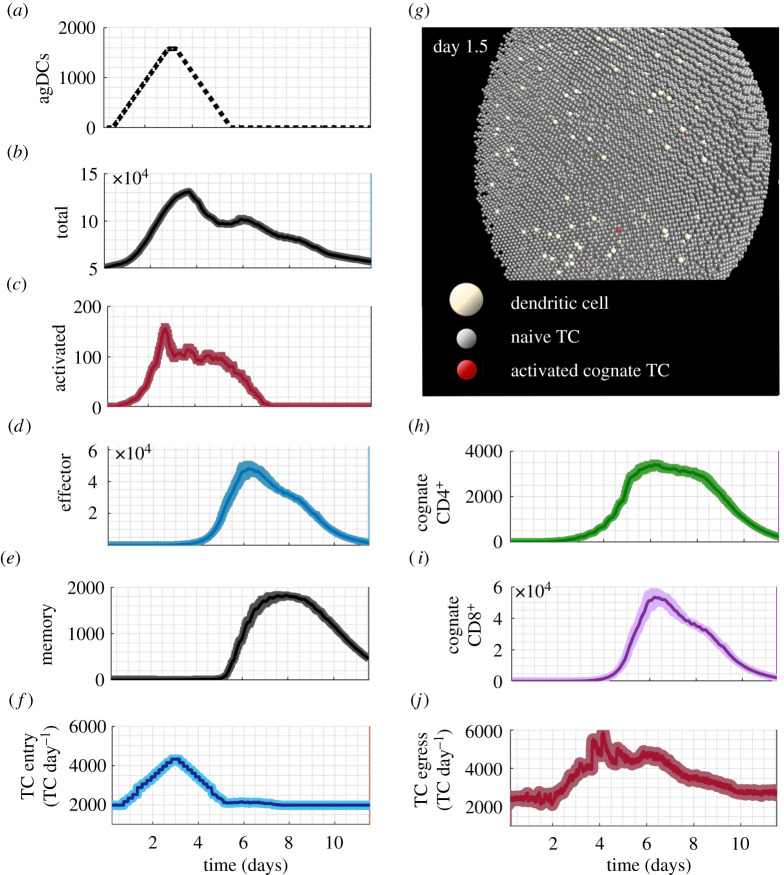
Figure 4.
TC responses in the paracortex following entry of agDCs under baseline conditions. The average result with s.e.m. of 12 simulations. (a) Incoming agDCs. (b) The total number of TCs peaked at 3.5 days, comprising mainly non-cognate naive TCs. (c) Activated TC appearance began 12 h after the first agDCs entered. (d) Effector TC number peaked at day 6. (e) Memory TCs appeared at 5 days and 25% of the peak number remained at the simulation end. (f) TC entry rate increased twofold, peaking at day 3. (g) Model interface showing day 1.5 with agDCs present and TC activation initiated. (h) Cognate CD4+ TCs began extensive proliferation at day 2.2. (i) Cognate CD8+ TCs began proliferation at day 4 and reached numbers 10-fold more than cognate CD4+ TCs. (j) TC egress rate declined between day 1 and 2, then increased threefold by day 4.

