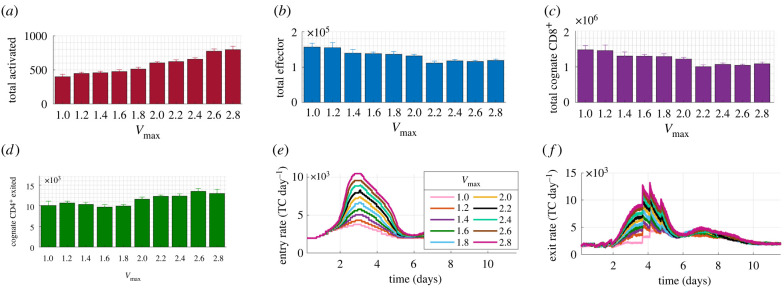
Figure 6.
Changes in TC response in the paracortex when varying swelling. Between Vmax = 1 and 2.8, (a) total activated TCs doubled and positively correlated with Vmax (R2 = 0.96, p = 1.07 × 10⁻⁶), (b) total effector TCs decreased 0.3-fold, negatively correlating with Vmax (R2 = 0.86, p = 1.23 × 10⁻⁴), (c) total cognate CD8+ TCs negatively correlated with Vmax (R2 = 0.855, p = 1.28 × 10⁻⁴), and (d) total cognate CD4+ TCs that exited increased 1.3-fold, positively correlating with Vmax (R2 = 0.76, p = 0.001). (e,f) Peak entry and exit rate increased proportionally to Vmax. Results are the mean of n ≥ 7 simulations with s.e.m. displayed.

