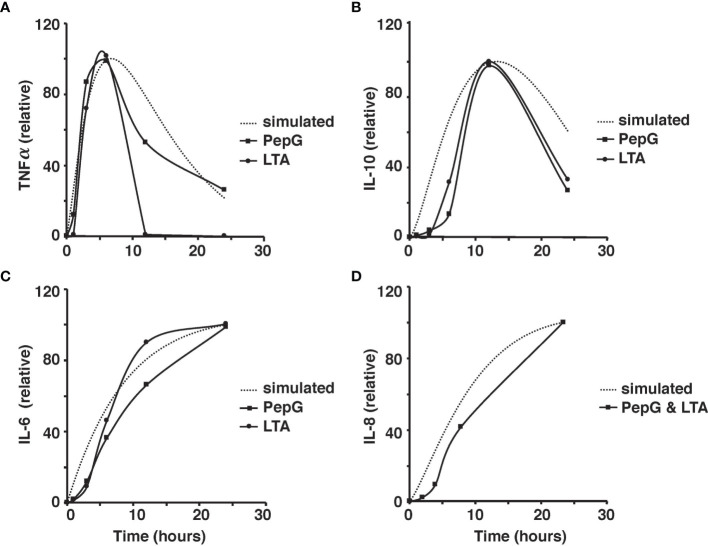
Figure 4.
Comparison of the simulated TNF-⍺ and experimental TNF-⍺ activity in response to the introduction of 10 μg of PepG/mL or 100 μg of LTA/mL of human blood over the 24-hour period (A). Comparison of the simulated IL-6 and experimental IL-6 activity based on the introduction of 10 μg of PepG/mL or 100 μg of LTA/mL of human blood over a 24-hour period (B). Comparison of the simulated IL-10 and experimental IL-10 activity based on the introduction of 10 microgram of PepG/mL or 100 μg of LTA/mL of human blood over the 24-hour period (C). Comparison of the simulated IL-8 and experimental IL-8 activity based on the introduction of S. aureus-infected endothelial cells containing 10 μg of PepG/mL and 100 μg of LTA/mL over the 24-hour period (D). All cytokine concentrations are relative values as discussed in the methods.

