Figure 6.
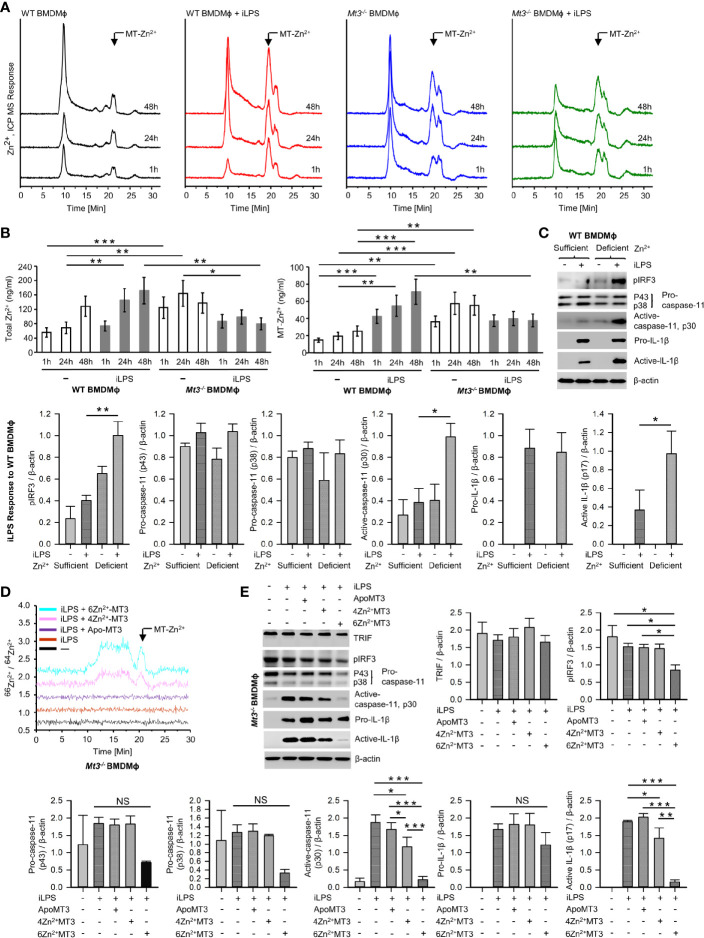
See also Supplementary Figures S6 , 7 MT3-Zn2+ axis drives negative regulation of the non-canonical inflammasome. (A) SEC-ICP-MS of WT and Mt3-/- BMDMϕ exposed to vehicle or iLPS (10 ug/ml) for the indicated time points, chromatograms depict Zn2+ distribution in cell lysates across various molecular masses, arrow indicates Zn2+ associated with the MT-peak (18-21 min.) on the chromatogram, Y axis is off-set to allow easy comparison under the same scale. (B) Bar graphs of total Zn2+ and MT-Zn2+ in WT and Mt3-/- BMDMϕ post iLPS (10 μg/ml) or vehicle exposure. Two-way t-test against respective BMDMϕ controls at each time point, 3 independent experiments, data are mean ± SD. (C) WT BMDMϕ treated with iLPS (10 μg/ml) or vehicle for 24h in Zn2+ sufficient or Zn2+ deficient Opti-MEM media, immunoblots of pIRF3, pro-caspase-11, active-caspase-11 and pro-IL-1β in lysates and active-IL-1β in media supernatants, one-way ANOVA, data are mean ± SEM. (D, E) Mt3-/- BMDMϕ transfected with Pro-Ject™ or Pro-Ject™ complexed with apo-MT3, 4Zn2+MT3 or 6Zn2+MT3 and treated with iLPS (10 μg/ml) or vehicle for 24h in Zn2+ deficient Opti-MEM media. (D) Chromatograms depict Zn2+ distribution in cell lysates across various molecular masses, arrow indicates Zn2+ signal associated with the MT-peak (18-21 min.) on the chromatogram, Y axis is off-set to allow easy comparison under the same scale. (E) Western blots of pIRF3, pro-caspase-11, active-caspase-11 and pro-IL1β in lysates and active-IL-1β in supernatants, 3 independent experiments, one-way ANOVA, data are mean ± SEM. *p < 0.05, **p < 0.01, ***p < 0.001; NS, not significant.

