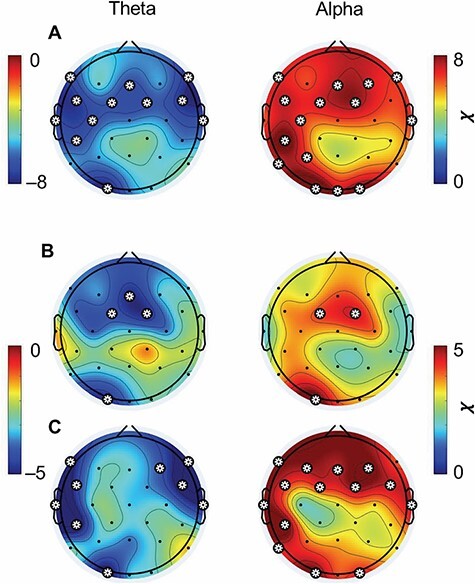
Figure 3.

Topographic plots of the relationship between theta (left) and alpha (right) amplitudes and meditation depth in the (A) two groups combined, (B) long-term meditators and (C) controls. Plotted are the square-root of the χ2 values of the interaction effects between depth level and theta and alpha amplitudes regressed upon self-reports. The values are signed by the direction of relationship, which was negative for theta and positive for alpha at all channels. Asterisks denote channels with significant interaction effects, thresholded for (A) at Bonferroni-corrected P < 2.5e–8 and (B–C) at Bonferroni-corrected P < 0.025
