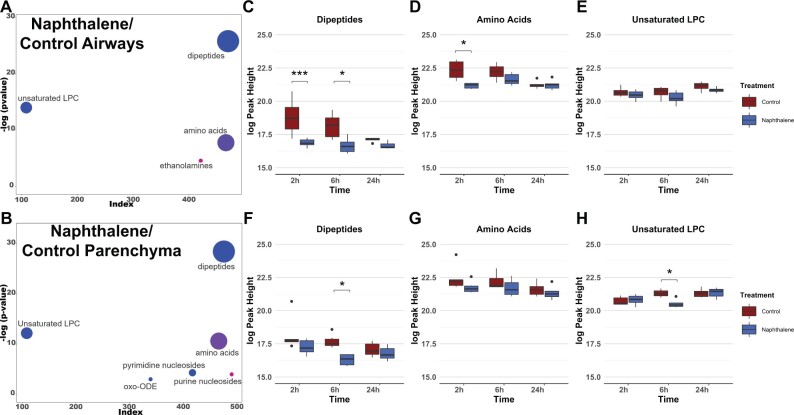
Figure 3.
Metabolite profiles of lung airways and parenchyma are altered in response to naphthalene-treatment in females 6 h postinjection. A and B, ChemRICH plots comparing naphthalene-treated airways and parenchyma in female mice 6 h postinjection, respectively. The size of each circle represents the relative number of metabolites contained within each cluster. Red circles indicate all metabolites increase within a cluster, whereas blue circles indicate all metabolites decrease within a cluster. Pink and purple circles represent a mix consisting of mostly increased and decreased metabolite abundances, respectively. Axes correspond to the −log p value of a metabolite class plotted against index values assigned to each metabolite in the online datasheet included as supplemental material. p values used for the input of each ChemRICH were calculated by 1-way ANOVA with Tukey’s post hoc analysis. p values for each ChemRICH cluster were calculated using the Kolmogorov-Smirnov test. C–H, Boxplots displaying the average intensities for the largest clusters of metabolite classes altered in female airways and parenchyma for all timepoints, respectively. Axes represent the log10 peak height of each sample for each timepoint, and samples with values greater than 1.5 times the interquartile range are indicated by dots on each plot. *p < .05, ***p < .001.

