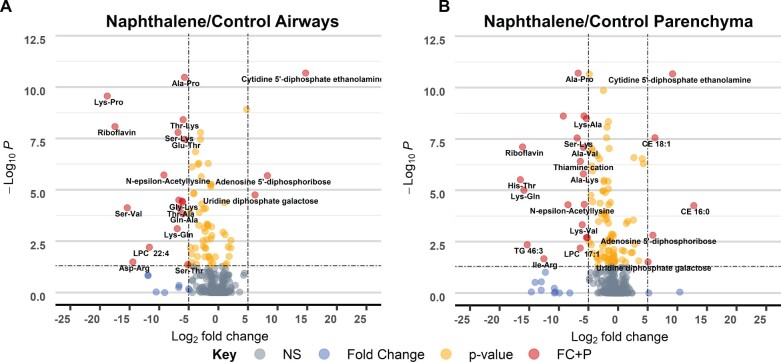
Figure 5.
Individual metabolite changes in naphthalene-treated female mice differ in magnitude and between tissues. A and B, Volcano plot of −log10p value versus log2 fold change of metabolites in naphthalene-treated airways and parenchyma relative to control, respectively. p values were determined using 1-way ANOVA with Tukey’s post hoc analysis. An arbitrary log2 fold change cut-off of 5 was used to indicate metabolites with especially large differences between treatment groups. A p value threshold of <.05 was selected to indicate statistical significance. Metabolites that pass both thresholds are indicated in red, whereas metabolites not passing either threshold are shaded in gray. Yellow and blue dots represent metabolites that only pass either the p value or fold change threshold, respectively.

