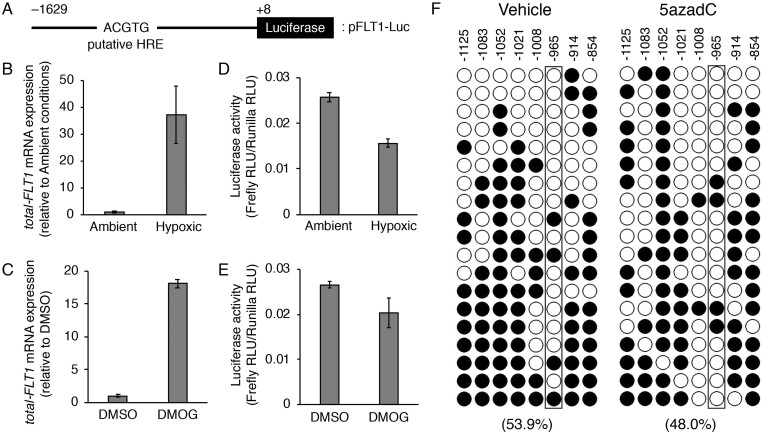
Figure 5.
The hypoxia response element (HRE) located ∼1 kb upstream of the transcription start site (TSS) in the FLT1 gene is not involved in the hypoxia- or DMOG-induced upregulation of the FLT1 gene in BeWo cells. (A) Schematic representation of the luciferase reporter construct, pFLT1-Luc. Numbering refers to the regions of the FLT1 promoter inserted into the parental pGL4.10 vector. The putative HRE is indicated within the −966/−962 promoter region. (B, C) The cells were transiently co-transfected with 1 μg of the pFLT1-Luc vector and 20 ng of the control renilla luciferase vector pGL4.74 (hRuc/TK). After 24 h of transfection, the cells were subjected to hypoxic or chemically mimicked hypoxic conditions for 24 h and the mRNA expression levels of all FLT1 transcript variants (total-FLT1) were measured by quantitative reverse transcription-polymerase chain reaction using β-actin mRNA as a reference. (D, E) Luciferase activity was measured under the same conditions as in (B) and (C). The firefly luciferase activity of the pFLT1-Luc reporter plasmid was normalized to that of renilla. The luciferase activity was measured in relative light units. (F) Methylation patterns in the promoter region of the FLT1 gene. The eight cytosine-phosphate-guanine (CpG) sites of FLT1 were analysed by bisulfite sequencing. The DNA methylation data were analysed by the QUantification tool for Methylation Analysis (http://quma.cdb.riken.jp/). Open circles and closed circles represent the unmethylated and methylated CpG sites, respectively. Numbers indicate the position relative to the TSS. Numbers in parentheses represent the overall percentage of methylated CpG sites. Boxed areas indicate the CpG site in the putative HRE.

