Figure 1:
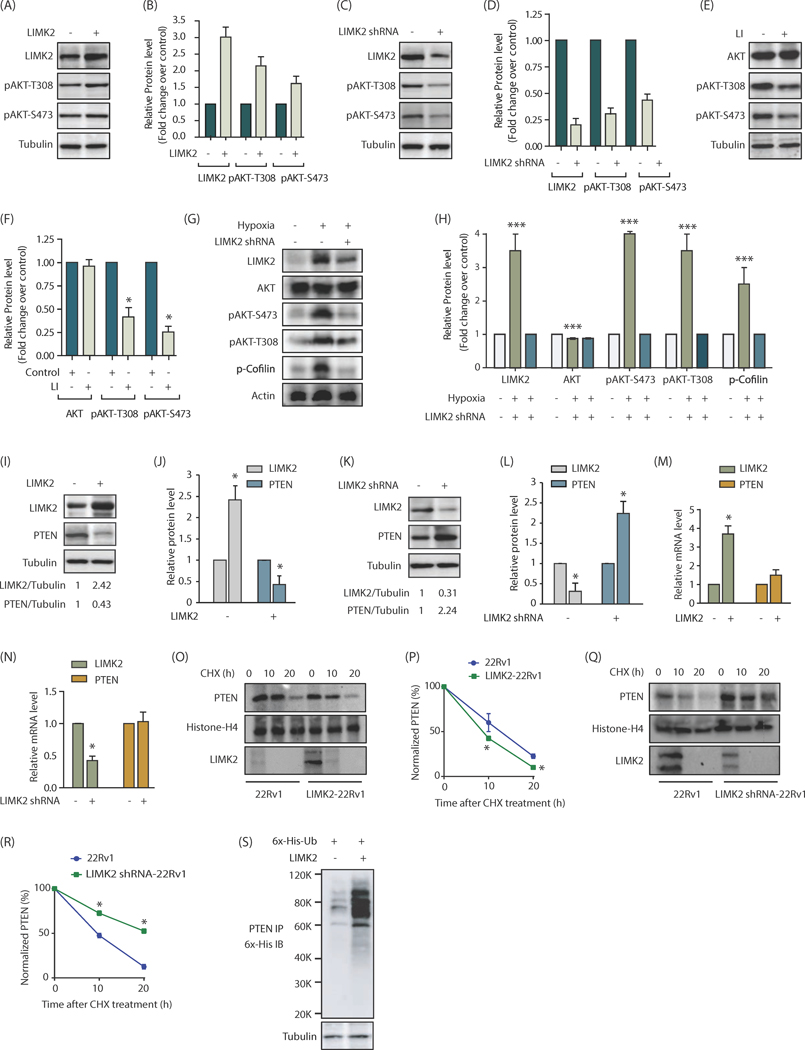
LIMK2 upregulates PI3K signaling by stabilizing PTEN. (A) LIMK2 upregulates phosphorylation of AKT at S473 and T308 in 22Rv1 cells. (B) Bar graph shows increase in p-AKT level at T308 and S473 positions upon LIMK2 overexpression. The data shown are mean ± SEM of three independent experiments. (C) LIMK2 knockdown inhibits AKT phosphorylation in 22Rv1 cells. (D) Histogram shows change in AKT phosphorylation. The data represented as mean ± SEM of three independent experiments. *P <0.05 compared to control cells. (E) Change in AKT phosphorylation in response to LIMK2 inhibitor, LI. 22Rv1 cells were treated with 10 μM LI for 12h followed by immunoblot analysis. Each experiment was performed at least three independent times. Representative data are shown. (F) Bar graph shows change in p-AKT phosphorylation levels upon LI treatment. *P <0.05 compared to control cells. (G) LIMK2 and AKT protein and phosphorylation levels in hypoxia-induced 22Rv1 cells or LIMK2 shRNA-treated 22Rv1 cells. To induce hypoxia 22Rv1 cells were exposed to hypoxic conditions for 24h. For depleting LIMK2, LIMK2 shRNA was added 18h prior to hypoxia treatment. (H) Bar graph showing LIMK2, AKT, p-cofilin and p-AKT levels under normoxic and hypoxic conditions ± LIMK2 knockdown. The data shown are mean ± SEM of three independent experiments., ***P<0.0005 (I) LIMK2 inversely regulates PTEN levels in 22Rv1 cells. LIMK2 and PTEN levels were analyzed in LIMK2-overexpressing 22Rv1 and vector infected cells. (J) The bar graph shows relative band intensities of LIMK2 and PTEN from 22Rv1 and LIMK2–22Rv1 cells normalized to the corresponding tubulin levels. Data are expressed as fold change relative to control; values represented as mean ± SEM of three independent experiments. *P <0.05 compared to control cells. (K) LIMK2 knockdown increases PTEN levels in 22Rv1 cells. 22Rv1 cells were treated with either scrambled shRNA or LIMK2-shRNA, and LIMK2 and PTEN levels analyzed. (L) Histogram shows relative band intensities normalized to the corresponding tubulin level. Data shown as mean ± SEM of three independent experiment. *P <0.05 compared to control cells. (M) LIMK2 overexpression or (N) LIMK2 knockdown does not affect PTEN mRNA levels as analyzed by qPCR analysis. (O) LIMK2 augments PTEN degradation. 22Rv1 and LIMK2–22Rv1 cells were treated with cycloheximide (CHX, 10 μM) for 10h and 20h, and LIMK2 and PTEN levels analyzed. (P) Graphical representation of PTEN degradation rate in cells treated as in O, *P <0.05 compared to control cells. (Q) LIMK2 knockdown decelerate PTEN degradation. (R) Graphical representation of PTEN degradation rate in cells treated as in Q. *P <0.05 compared to control cells. (S) LIMK2 increases PTEN degradation by promoting its ubiquitylation. 22Rv1 cells were co-infected with 6x-His–ubiquitin (6x-His-Ub) along with LIMK2 overexpressing retrovirus for 30h, followed by a 12h MG132 treatment. PTEN proteins was immunoprecipitated and ubiquitylation analyzed using 6x-His antibody. Each experiment was done at least three independent times and representative data is shown.

