Figure 2:
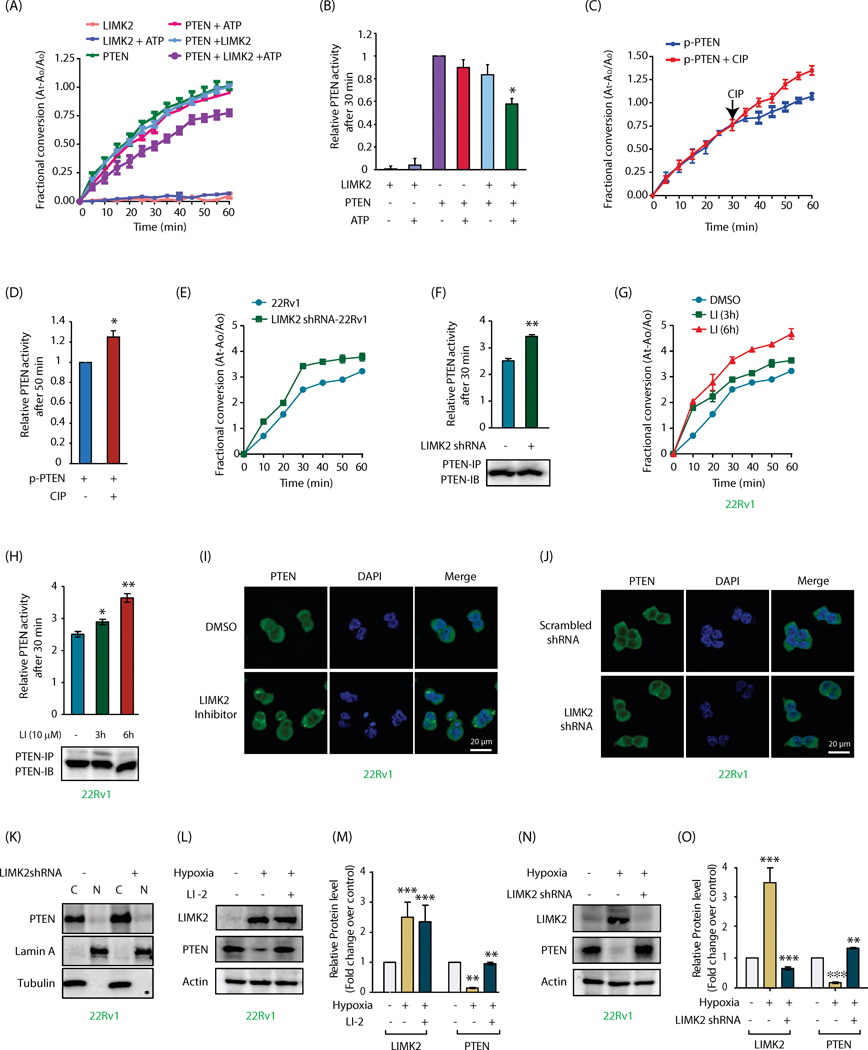
LIMK2 inhibits PTEN phosphatase activity in vitro and in cells and downregulates its levels upon hypoxia. (A) LIMK2-mediated phosphorylation of PTEN decreases its phosphatase activity. PTEN was immunoprecipitated from 22Rv1 cell lysate and subjected to LIMK2 kinase assay. PTEN activity was calculated using PIP3 as a substrate. The signal was obtained by measuring the absorbance of free phosphate over time at 620 nm. (B) Same data as Figure 2A showing PTEN phosphatase activity at 30 min. (C) Dephosphorylation of PTEN by calf intestinal alkaline phosphatase (CIP) increases its phosphatase activity. Each experiment was repeated three independent times. Representative data are shown. (D) Same data as Figure 2C showing PTEN phosphatase activity at 50 min. (E) LIMK2 knockdown augments PTEN phosphatase activity in 22Rv1 cells. (F) Same data as Figure 2E showing PTEN phosphatase activity at 30 min along with immunoblots showing loading control of PTEN for each reaction, **P<0.005. (G) Treatment with 10 μM LIMK2 inhibitor for 3 and 6 h increases PTEN activity in 22Rv1 cells. (H) Quantification of data in Figure 2G showing PTEN phosphatase activity at 45 min. *P<0.05, **P<0.005 (I) Immunofluorescence analysis to detect PTEN localization in response to LIMK2 inhibitor in 22Rv1 cells. (J) Immunofluorescence analysis to detect PTEN localization in response to LIMK2 knockdown in 22Rv1 cells. (K) Subcellular fractionation of PTEN in 22Rv1 and LIMK2 shRNA-treated 22Rv1 cells. Alpha-tubulin and lamin A are the cytoplasmic marker and nuclear marker, respectively. N, nuclear fraction; C, cytoplasmic fraction. (L) LIMK2 negatively regulates PTEN protein level under hypoxic conditions. LIMK2 inhibition using LI rescues the loss of PTEN. (M) LIMK2 and PTEN protein levels in hypoxia facing 22Rv1 cells in presence and absence of LIMK2 inhibitor. Data shown are mean ± SEM of three independent experiments. **P < 0.005, ***P<0.0005 vs control cells. (N) Effect of hypoxia on PTEN protein levels in the presence and absence of LIMK2 shRNA. (O) Bar graph shows LIMK2 and PTEN protein levels in cobalt chloride ± LIMK2 shRNA cells. *P < 0.05 vs control cells.

