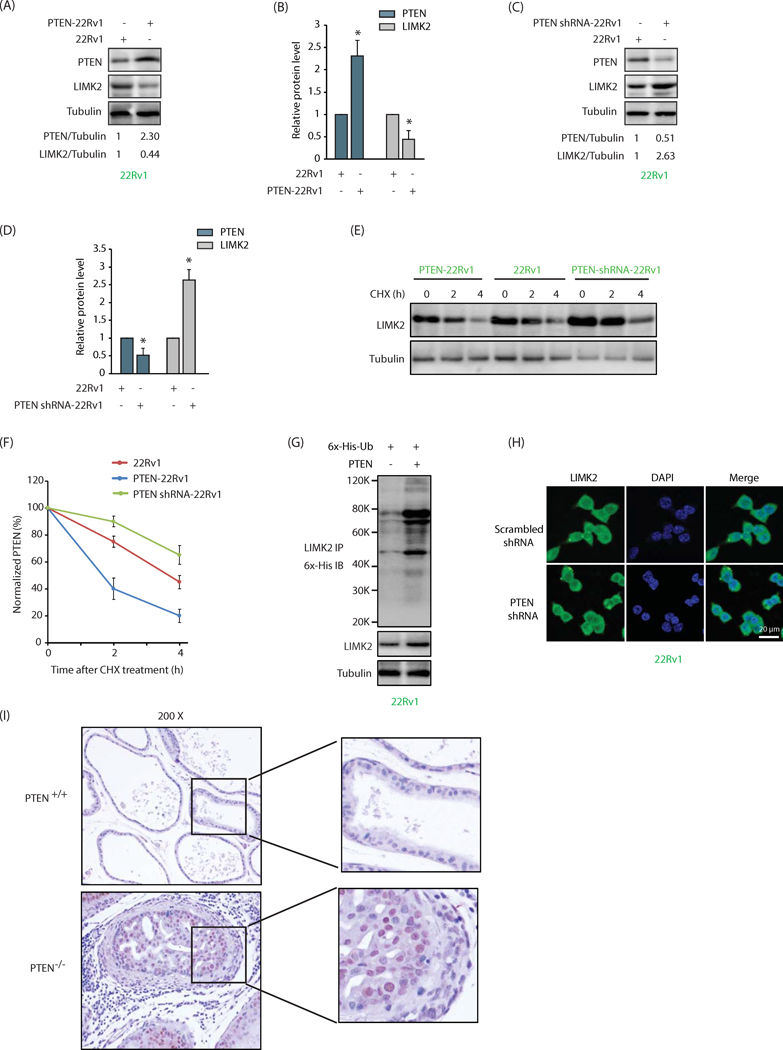
Figure 3:
PTEN engages in a negative feedback loop with LIMK2. (A) PTEN overexpression depletes LIMK2 protein in 22Rv1 cells. (B) Histogram shows relative band intensities of PTEN and LIMK2 normalized to the corresponding tubulin level. Data shown are mean ± SEM of three independent experiments. *P <0.05 compared to control cells. (C) PTEN knockdown increases LIMK2 levels in 22Rv1 cells. (D) Histogram shows relative band intensities normalized to the corresponding tubulin level. Data shown as mean ± SEM of three independent experiment. (E) PTEN accelerates LIMK2 degradation. 22Rv1, PTEN-22Rv1 and PTEN shRNA-22Rv1 cells were treated with cycloheximide (CHX) for 2 and 4h, and LIMK2 levels analyzed. (F) Graphical representation of PTEN degradation rate. (G) PTEN degrades LIMK2 by promoting its ubiquitylation. Each experiment was repeated at least three independent times and a representative data is shown. (H) PTEN knockdown does not alter LIMK2 localization in 22Rv1 cells. (I) LIMK2 levels are higher in prostates from PTEN−/−mice as compared to prostates from PTEN+/+ mice. Diaminobenzidine staining of LIMK2 in prostate tissues of wild-type PTEN+/+ and homozygous depleted PTEN −/− mice at the age of 3 months. PTEN was depleted in a prostate-specific manner.

