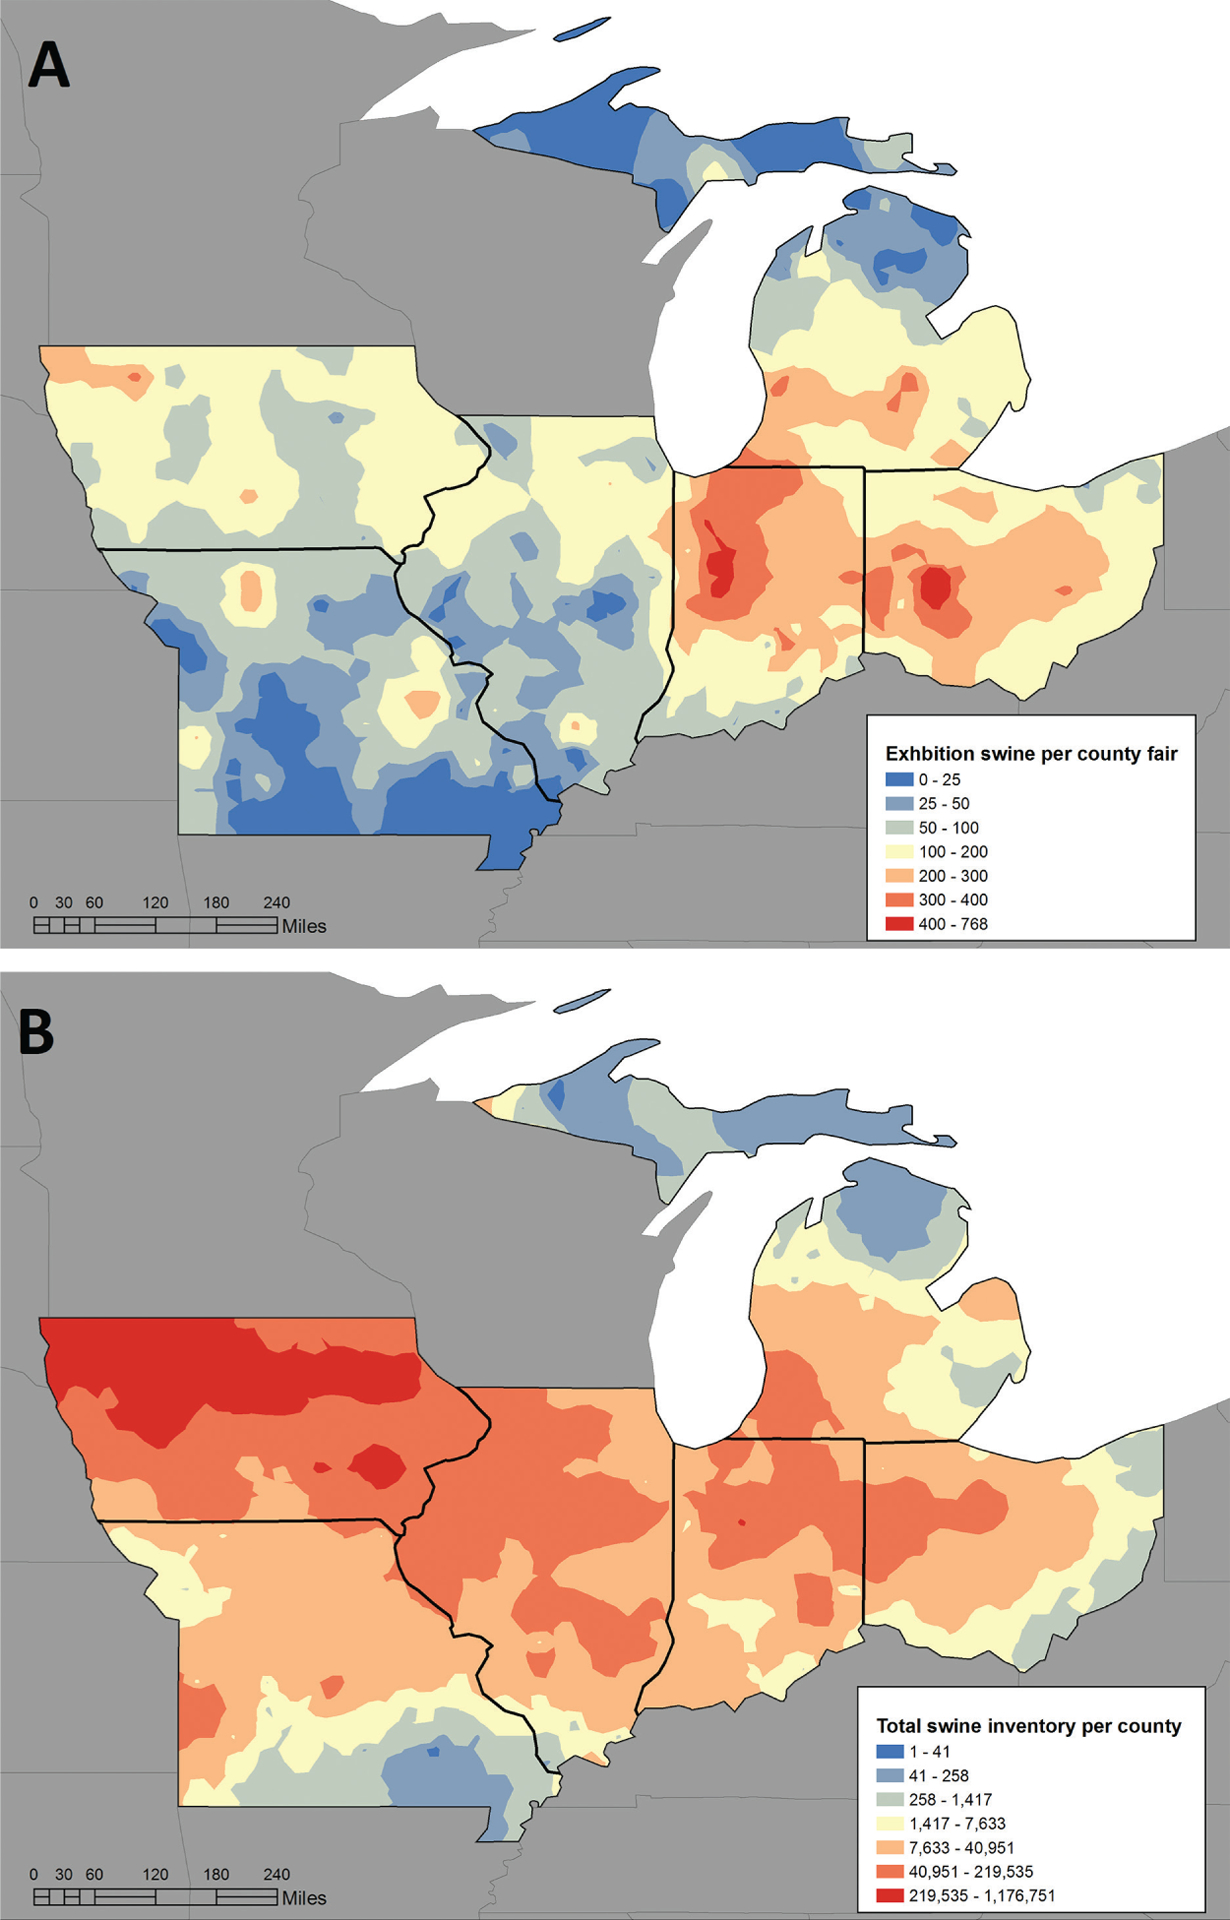
Figure 1—

Reported numbers (heat maps) of exhibition and commercial swine in the Midwestern United States by geographic region in 2013. A—Distributions of exhibition swine at county fairs during 2013 in Illinois, Indiana, Iowa, Michigan, Missouri, and Ohio. B—Total swine (exhibition and commercial) distributions in each county in 2012, per the USDA 2012 Census of Agriculture. In both panels, dark red indicates the highest density of swine, and dark blue represents the lowest density of swine.
