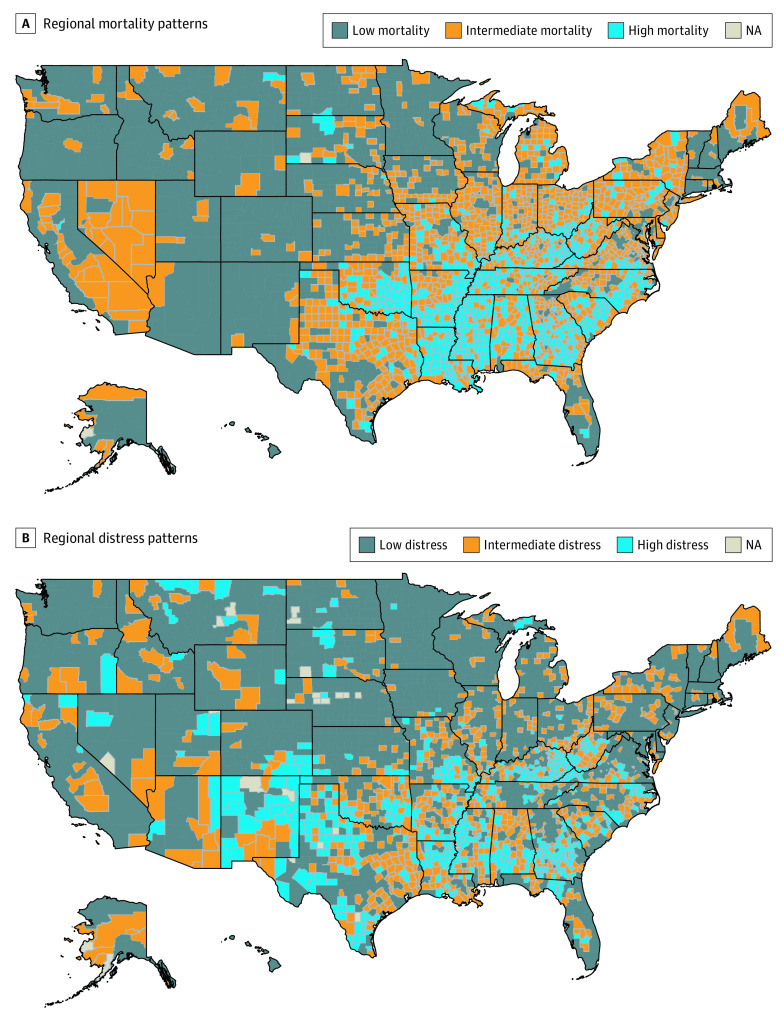
Figure 2. Choropleths Depicting Regional Patterns of Mortality and Distress.
A, Choropleth depicting regional distribution of cluster membership, with the highest-mortality counties clustered in the Deep South and Appalachia and the lowest-mortality counties clustered predominantly in the Northwestern, Western, and Midwestern US. B, Choropleth demonstrating the proportion of counties with greater than 80% population in distressed zip codes (highest distress), 20% to 80% population in distressed zip codes (intermediate distress), and less than 20% population in distressed zip codes (lowest distress). Substantial regional overlap is observed between counties with a high proportion of the population living in distressed zip codes and the high-mortality cluster.

