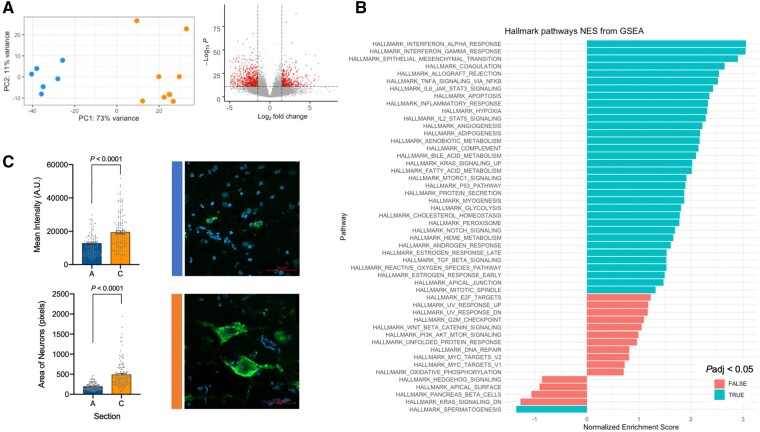
Figure 3.
Somatic mutations contribute to brain disease. (A) Principal component analysis of bulk RNA-seq data from all 15 brain sites reveals distinct clustering related to genotype (blue: anterior cerebrum/exon 5 variant detected; orange: posterior cerebrum/both variants detected). Volcano plot depicting differentially expressed genes in posterior versus anterior brain samples. (B) Gene set enrichment analysis (GSEA) showing enriched hallmark pathways including MTORC1 signalling. (C) Phospho-S6 immunofluorescence intensity is higher in posterior section C compared to anterior section A, which corresponds to larger neuronal area. Mean ± standard error of the mean. NES = normalized enrichment score.

