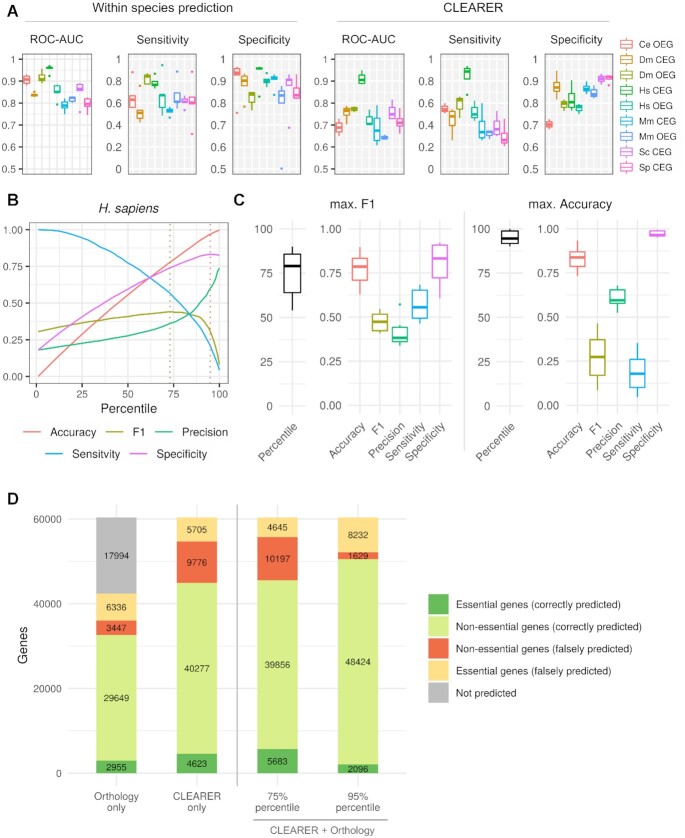
Figure 4.
Performance of CLEARER. (A) Comparison of the prediction performance within and across species from all cross-validations. Species abbreviations are as listed in Table 1. (B) Line graph illustrating the maximal F1-score and accuracy cutoff for H. sapiens after combining CLEARER and the orthology-based approach. Dotted lines indicate maxima. (C) Box plots showing the percentiles and performance metrics for the maximal F1- score and maximal accuracy for the six model organisms. (D) Bar graphs showing the total number of correct and incorrect predicted genes.

