Figure 5.
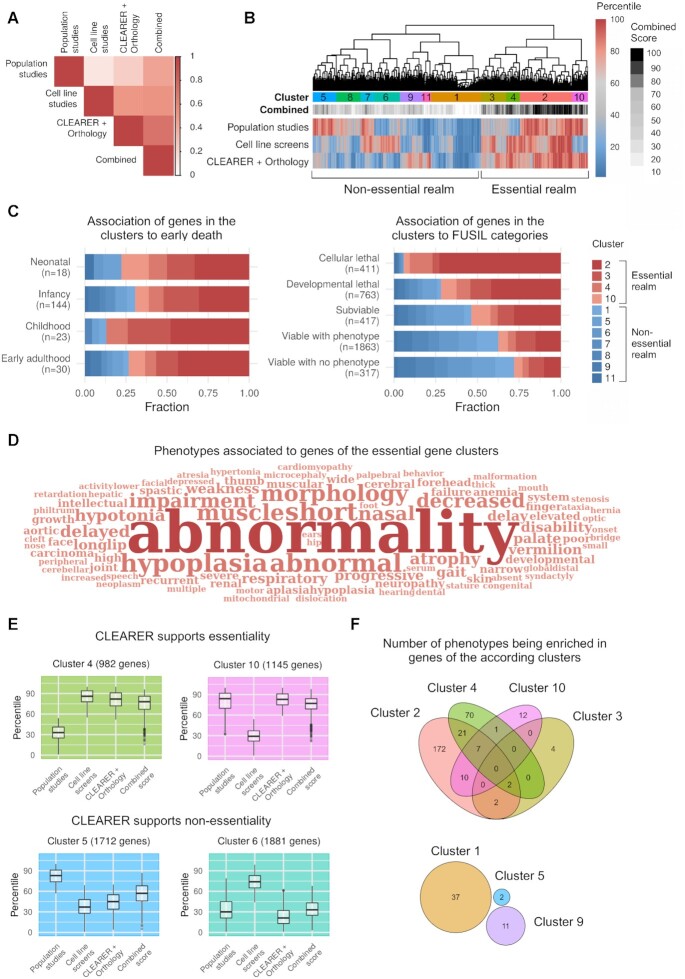
CLEARER supports identifying essential genes for human. (A) Correlation of experimental and computational scores. Scores from five population studies and ten cell line screens were combined and compared to predictions from CLEARER. The highest correlation was found when combining the experimental data and computational predictions. (B) Clustering of computational and experimental scores separates essential and non-essential genes. (C) Essential gene clusters associate with early death and lethality from Full Spectrum of Intolerance to Loss-of-function categories by Cacheiro et al. (68). (D) Word cloud illustrating enriched phenotype-to-gene associations of genes from the essential gene clusters. (E) Box plots of the scores of the four essential gene clusters illustrate how CLEARER supported the final decision-making towards or against essentiality. (F) Venn diagrams showing the number of overlapping and non-overlapping phenotypes being enriched in genes of the according clusters. Notably, for the non-essential gene clusters 6, 7, 8 and 11 no enriched phenotype was identified.

