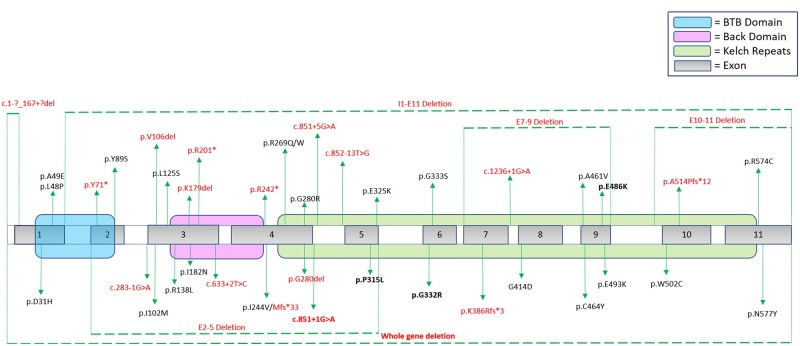
Figure 1.
GAN mutations. Figure shows the GAN gene with mapping of the variants in our study cohort. Variants with deletions are noted with dashed lines above and below the gene map. Variants with predicted loss of function (‘null’ mutations) are shown in red. Variants that were recurrent in unrelated individuals in this study are highlighted in bold. Domains of the GAN gene are shown in colour including the BTB domain (blue), Back domain (pink) and Kelch Repeat domain (green).

