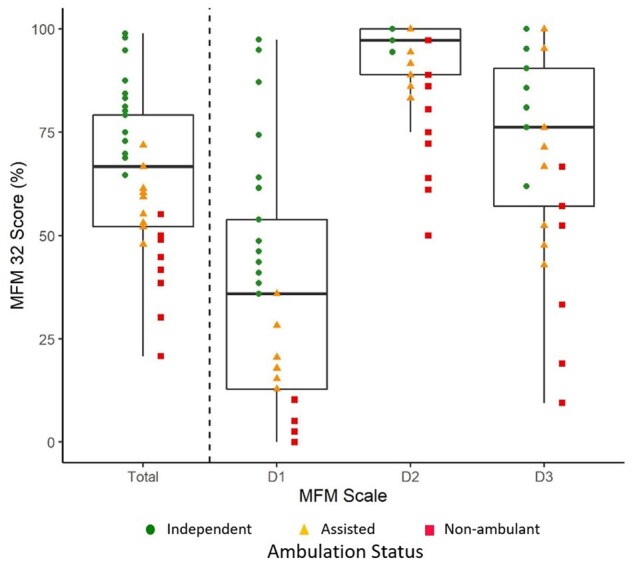
Figure 5.

Ambulation status by MFM-32 score and subscale. Ambulation status by MFM-32 total percentage score and the MFM-32 subdomain (D1, D2 or D3) percentage scores are plotted. This plot only includes individuals over the age of 6 where MFM-32 was performed (n = 37). Eighteen individuals were independently ambulant, 10 required assistance to walk, and nine were non-ambulant (as indicated by the coloured shapes). Each individual’s total score and subscale score are plotted. The box plots highlight the MFM-32 total percentage score as well as the percentage score for the subdomains with scores as follows [median (25th percentile; 75th percentile)]: MFM-32 total, 64.5 (52.10; 79.17); D1, 35.55 (12.82; 53.85); D2, 91.21 (88.9; 100); D3, 72.46 (57.1; 90.5). Whiskers reflect relationship to the upper and lower limits as calculated using the IQR [e.g. upper limit defined as Q3 + 1.5(IQR) or lower limit defined as Q1 − 1.5(IQR)]. The MFM-32 total score, D1 score and the D3 score are distributed across the range of scores from more severe to milder, while the D2 domain appears to show a possible ceiling effect, with a lower D2 score not seen until individuals have lost ambulation.
