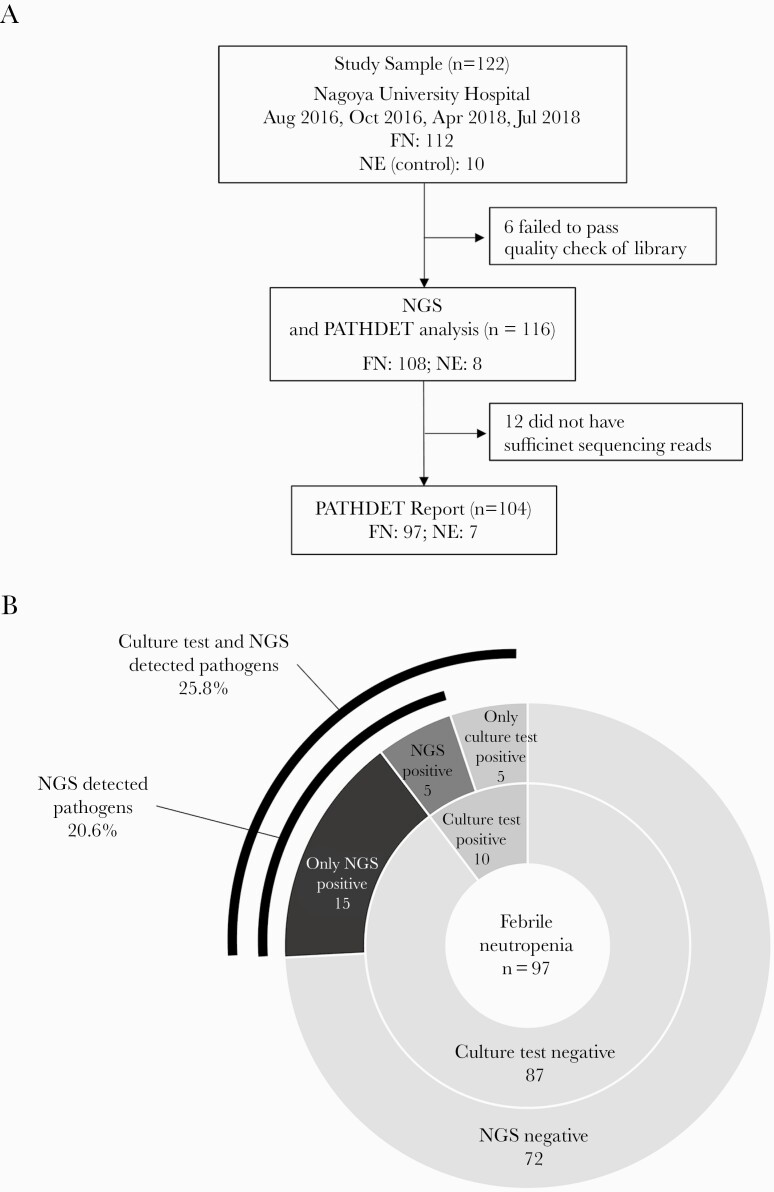
Figure 1.
Flowchart and pie charts of the results in patients with febrile neutropenia (FN) and patients with neutropenia without fever (NE). A, Flowchart of the patient selection and comparison. B, Comparison of the results between next-generation sequencing (NGS) analysis and blood culture in patients with FN. The ratio of positive results in patients with FN is shown as a pie chart.

