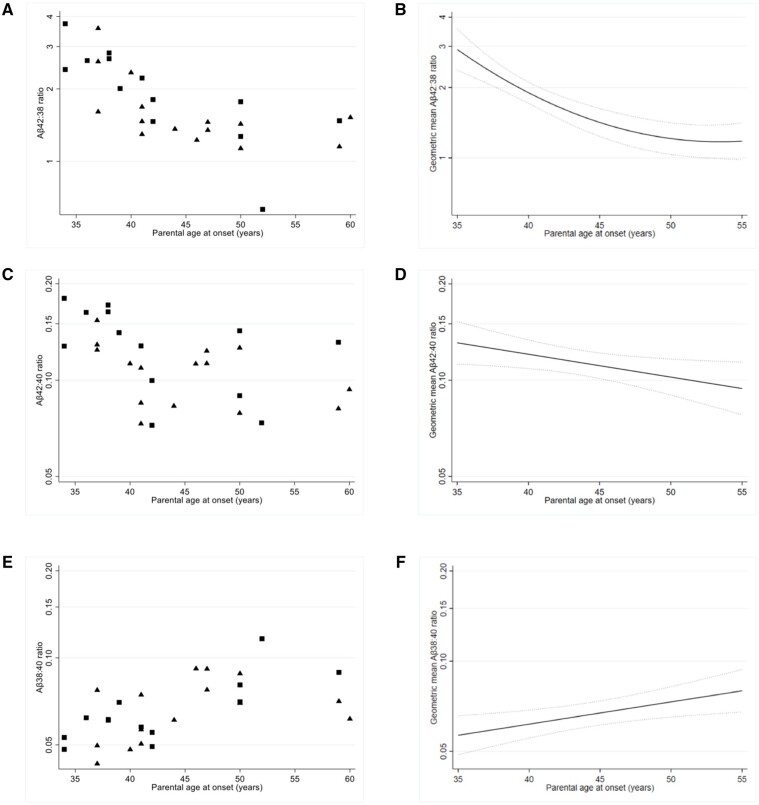
Figure 2.
Plasma amyloid-β ratios against parental AAO in PSEN1 carriers. Scatter plots of observed plasma (A) Aβ42:38 (C) Aβ42:40 and (E) Aβ38:40 values against parental age at onset (AAO). Symptomatic mutation carriers are identified by square symbols and presymptomatic mutation carriers by triangle symbols. Modelled geometric mean of plasma (B) Aβ42:38 (D) Aβ42:40 and (F) Aβ38:40 against parental AAO in PSEN1 carriers; models adjust for EYO, sex and ‘normal ageing’ in non-carriers. The trajectories displayed contain an equal mix of males and females and are adjusted for ‘normal ageing’ relative to age 43 (the average age of mutation carriers). EYO is set at 0, i.e. point of symptom onset, in all three trajectory plots. The y-axis scale is logarithmic in all panels.

