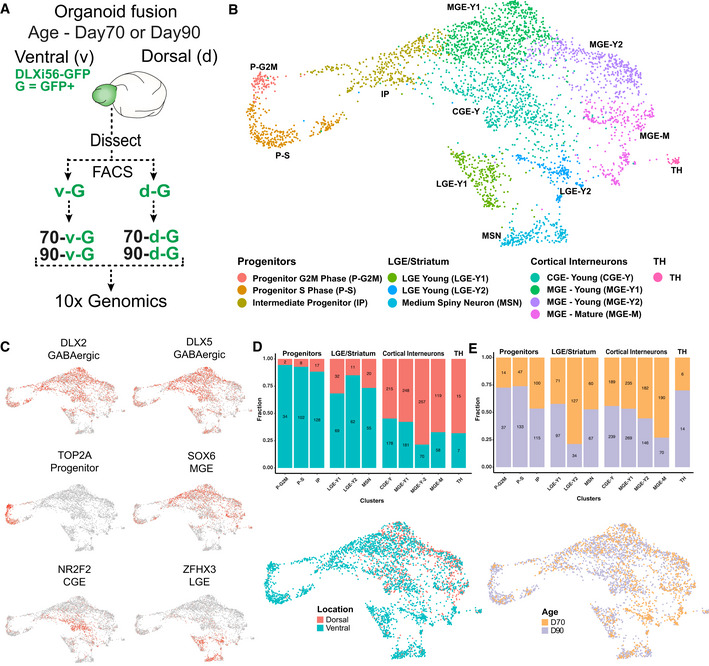
Figure 2. scRNAseq identifies spatial axis of maturation of human cortical interneurons.

- Schematic overview of experimental setup for single‐cell RNA sequencing of human cortical interneurons from organoids. GFP+ cells from the dorsal and ventral regions of 70‐ or 90‐day‐old organoid fusions were obtained by flow cytometry and sequenced individually.
- Visualization of single‐cell RNA‐sequencing data from GFP+ cells from the different groups mentioned in 2A using UMAP after removal of stressed cells (Fig EV3A–D). Clusters are color‐coded according to the cell type.
- UMAPs depicting the expression of GABAergic markers DLX2 and DLX5, progenitor marker TOP2A, MGE marker SOX6, CGE marker NR2F2, and striatal marker ZFHX3.
- Proportions (y‐axis) and numbers (within bars) of cells arising from the different regions of a fusion are listed for each cluster. Numbers are down‐sampled to 941 cells in the smallest region group for proper representation. UMAP depicting the fusion region from which the cells were isolated.
- Proportions (y‐axis) and numbers (within bars) of cells arising from the different fusion ages are listed for each cluster. Numbers are down‐sampled to 1,221 cells in the smallest age group for proper representation. UMAP depicting the fusion age at which the cells were isolated.
