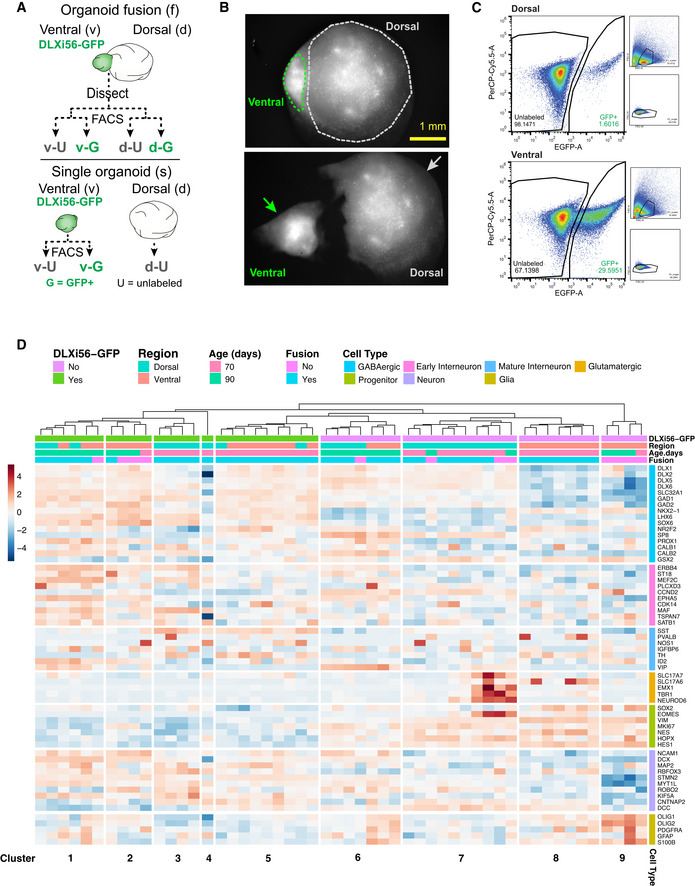
Figure EV2. RNA sequencing reveals cellular transcriptomes in organoids.

- Schematic representation of the experimental strategy for the RNA sequencing of cells from single and fused organoids. GFP+(G) and GFP‐/unlabeled(U) cells were obtained from both ventral and dorsal regions of dissected organoid fusions. G and U cells were obtained from single ventral organoids, and U cells were obtained from single dorsal organoids. In total, 7 different populations of cells were then analyzed using RNA sequencing.
- Representative visualization of fusion using brightfield imaging for identification of ventral and dorsal regions during manual dissection. Images show fusion before and after dissection.
- Flow cytometry plots for dissociated cells from either dorsal or ventral regions of dissected fusions. Cells were sorted based on their EGFP intensity (x‐axis). GFP+ proportion within each region is indicated within figure (dorsal—1.6%; ventral—29.59%). Across multiple dissections, proportions for GFP+ cells remained consistently at 1–7% for dorsal regions and 30–50% for ventral regions.
- Heatmap depicting the weighted gene expression (z‐score, bar indicating values from blue to red) of the different cell populations analyzed using RNA sequencing. Populations were stratified according to their GFP positivity, region they were isolated from, organoid age and whether they were isolated from a region of a fusion or a single organoid. Genes are sorted into groups relating to the cell type they relate to. Hierarchical clustering separates the individual samples into clusters which are labeled at the bottom.
Source data are available online for this figure.
