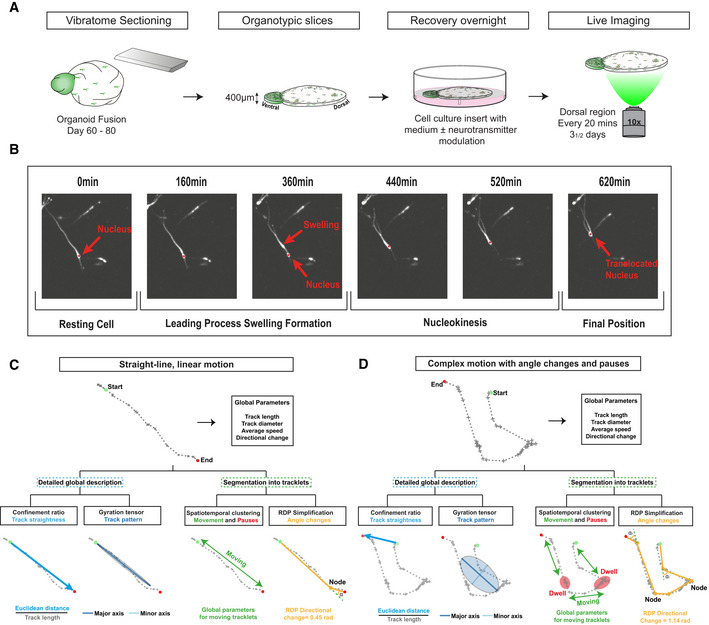
Figure 4. TrackPal quantifies human cortical interneuron migration.

- Cortical interneuron migrationSchematic overview of setup for live‐imaging analysis of organoid fusions. Organoids at day 60–80 were sectioned with a vibratome to obtain 400‐µm‐thick sections. Dorsal regions of sections were then imaged every 20 min for three and a half days.
- Illustration of saltatory tangential migration performed by an interneuron. Nucleus is marked with a red asterisk. All images taken on a spinning disk confocal microscope at 10× magnification.
- Overview of different parameters calculated by TrackPal, which are used for track analysis of a track with straight‐line motion. Global parameters provide initial assessment, after which the track is analyzed by either detailed global analysis parameters or segmented into tracklets. For global analysis, the confinement ratio provides information on the track straightness and the gyration tensor is used to analyze the area covered by a cell. For track segmentation, either spatiotemporal density‐based clustering (DBSCAN) or the Ramer–Douglas–Peucker (RDP) simplification algorithm is used. Subsequently, detailed analysis is performed on the tracklets. Green and red dots mark the beginning and end of track. Yellow dots are nodes between different segments of the track in the RDP algorithm. Movement period of the cell is marked as “Moving”.
- Overview of different parameters calculated by TrackPal, which are used for track analysis of a track with multiple directional changes and pausing periods. Parameters are analyzed as mentioned in 4C. Green and red dots signal the beginning and end of track. Yellow dots are nodes between different segments of the track in the RDP algorithm. Note, that the movement period (green) is separated by multiple phases of dwelling (red), that are marked as “Dwell” and “Moving” respectively.
