Figure 2.
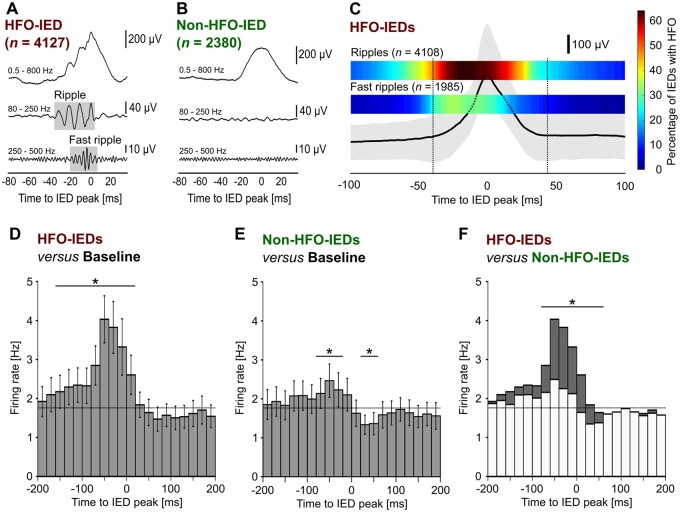
HFOs and neuronal firing are coupled to the ascending phase of IEDs. (A) Example IED with associated HFO (HFO-IED). Boxes in grey indicate a visually identified ripple (80–250 Hz) and a fast ripple (250–500 Hz) in band-pass filtered traces. (B) Example IED without associated HFO (non-HFO-IED). (C) Temporal coupling of IEDs and HFOs. Median (bold line) and 25th to 75th percentile (grey-shaded area) of all HFO-IEDs; the two heat maps above show the percentage of IEDs with a ripple or fast ripple at a specific time relative to the IED peak. Note that HFOs occur preferentially during the ascending phase of IEDs. (D) Temporal coupling of HFO-IEDs and multi-unit activity (n = 108 units). Histogram shows mean firing rate and standard error of the mean (error bars) during HFO-IEDs. Asterisks indicate significant changes compared to baseline (horizontal bar, P < 0.001). Note that a pronounced increase in multi-unit activity occurs before and during the IED peak. (E) In non-HFO-IEDs, there was only a moderate pre-peak increase (P < 0.01), followed by a post-peak suppression (P < 0.05) of firing. (F) Direct comparison of HFO- versus non-HFO-IEDs reveals significantly higher firing in HFO-IEDs from −80 to +60 ms (P < 0.001).

