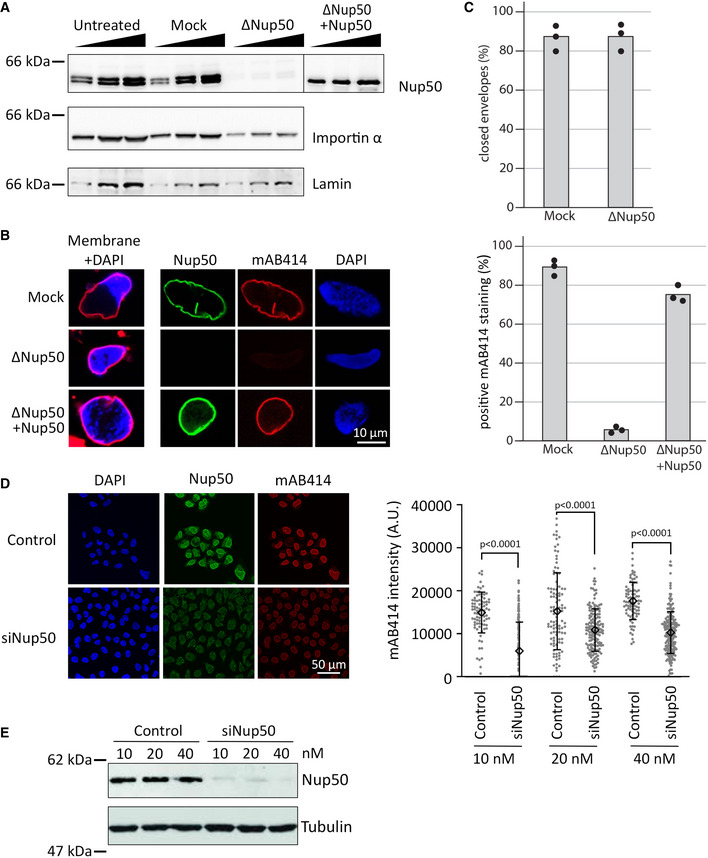
Figure 1. Nup50 is crucial for NPC assembly.

- Western blot analysis of untreated, mock‐ and Nup50‐depleted Xenopus egg extracts, with or without addition of recombinant Xenopus Nup50. 1, 2, and 4 µl of extracts were analyzed with indicated antibodies.
- Confocal microscopy images of fixed nuclei assembled for 120 min in mock‐depleted (mock) and Nup50‐depleted (ΔNup50) Xenopus egg extracts supplemented with either buffer or recombinant Nup50. In the left column, membranes were prelabeled with DiIC18 (1,1'‐dioctadecyl‐3,3,3',3'‐tetramethylindocarbocyanine perchlorate, red), and chromatin was stained with DAPI (4′,6‐diamidin‐2‐phenylindol, blue). Three right columns show the immunofluorescence staining for Nup50 (green) and NPCs (mAB414, red) on the chromatin (DAPI, blue). Scale bars: 10 µm.
- The average percentage of closed nuclear envelopes (upper panel) and mAB414‐positive nuclei (lower panel) for 100 randomly chosen chromatin substrates in each of 3 independent experiments is shown. Data points from individual experiments are indicated.
- HeLa cells were transfected with 20 nM control or Nup50 siRNA. 72‐h post‐transfection, cells were fixed with 4% PFA and stained with antibodies against Nup50 and mAB414, chromatin was labeled with DAPI. Scale bars: 50 µm. Quantitation of the mAB414 rim intensity at three different Nup50 RNAi and control oligo concentrations: 10 nM control (n = 84) or Nup50 siRNA (n = 171), 20 nM control (n = 101) or Nup50 siRNA (n = 157) and 40 nM control (n = 86) or Nup50 siRNA (n = 204). The means are indicated as diamonds; error bars show the standard deviations. P‐values have been calculated from a Student t‐test comparing the mean between the experimental conditions.
- Western blot analysis of HeLa cells treated as in (D) 72 h post transfection.
Source data are available online for this figure.
