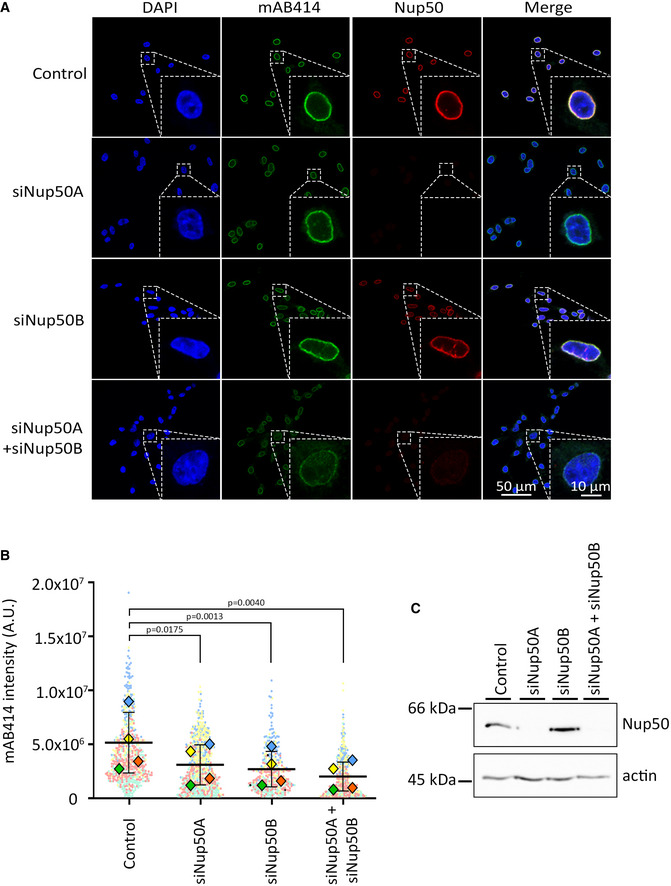
Figure 2. Two Nup50 paralogs in mouse cells.

- Mouse 3T3‐NIH cells were transfected with 20 nM control, Nup50A, Nup50B, or a combination of Nup50A and Nup50B siRNA. After 72 h, cells were fixed and stained with mAB414 (green) and antibodies against mouse Nup50 (red). Chromatin is stained with DAPI (blue). The merge of the three channels is shown on the left column. Scale bar: 50 µm. An insert shows a zoom on a representative nucleus for each picture. Scale bar: 10 µm.
- Quantitation of the mAB414 rim intensity from n = 4 independent experiments done as in (A), each represented by a different color. The mean of each individual experiment and condition is represented by a diamond; the mean of all four experiments by a horizontal black line. P‐values have been calculated from a paired ratio t‐test comparing the mean between the experimental conditions. Error bars show the standard deviations of the means.
- Western blot showing the amount of Nup50A (top row) for each of the experimental condition. The actin (lower row) is shown as a loading control.
Source data are available online for this figure.
