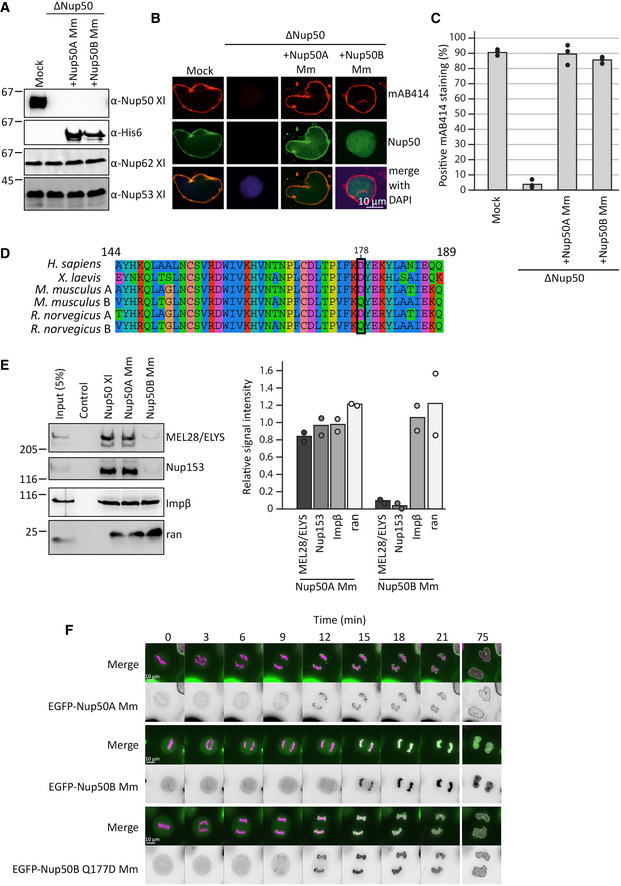
Figure 7. Both mouse Nup50 orthologs can replace the Xenopus protein.

- Western blot analysis of mock‐ and Nup50‐depleted Xenopus egg extracts (ΔNup50), with or without addition of recombinant mouse Nup50 orthologs. Samples were analyzed with Xenopus Nup50 antibodies, which do not recognize the mouse proteins, which in turn were detected with an His6 antibody.
- Confocal microscopy images of fixed nuclei assembled for 120 min in mock‐depleted (mock) and Nup50‐depleted (ΔNup50) Xenopus egg extracts supplemented with recombinant mouse Nup50 orthologs. Nuclei were stained for Nup50 (Nup50 antibody for Xenopus protein, His6 for mouse proteins) and NPCs (mAB414, red) on the chromatin (DAPI). Scale bar: 10 µm.
- The average percentage of mAB414‐positive nuclei for 100 randomly chosen chromatin substrates in each of three independent experiments (performed as in B) is shown. Data points from individual experiments are indicated.
- Sequence comparison of the conserved 46‐aa fragment of the human, mouse, rat, and Xenopus laevis sequences, with the residue 178 (Xenopus numbering), crucial for NPC binding in the Xenopus protein, is highlighted (black box). The color scheme indicates the type of amino acids according to the alignment software default setting.
- GST fusion constructs of the Xenopus Nup53 RRM domain (aa 162–267, control) full‐length Xenopus Nup50, and the two mouse Nup50 orthologs were incubated with Xenopus egg extracts. Starting material as well as bound proteins were analyzed by Western blotting with indicated antibodies (see Appendix Fig S1E for a gel showing the GST‐baits). The right panel shows the average MEL28/ELYS, Nup153, and importin β (Impβ) and ran bead‐bound signal from two independent experiments normalized to their respective Xenopus signal. Data points from individual experiments are indicated.
- HeLa cells were transfected with EGFP‐tagged constructs of both mouse Nup50 orthologs and the Nup50B Q177D (ortholog to the position 178 in Xenopus) mutant. After 24 h, the cells were analyzed by live cell imaging. Panel shows cells exiting mitosis (time normalized to metaphase‐to‐anaphase transition). The merge shows histone 2B in pink and Nup50 in green, and the black‐and‐white panel shows EGFP‐Nup50 signal. Scale bar: 10 µm.
Source data are available online for this figure.
