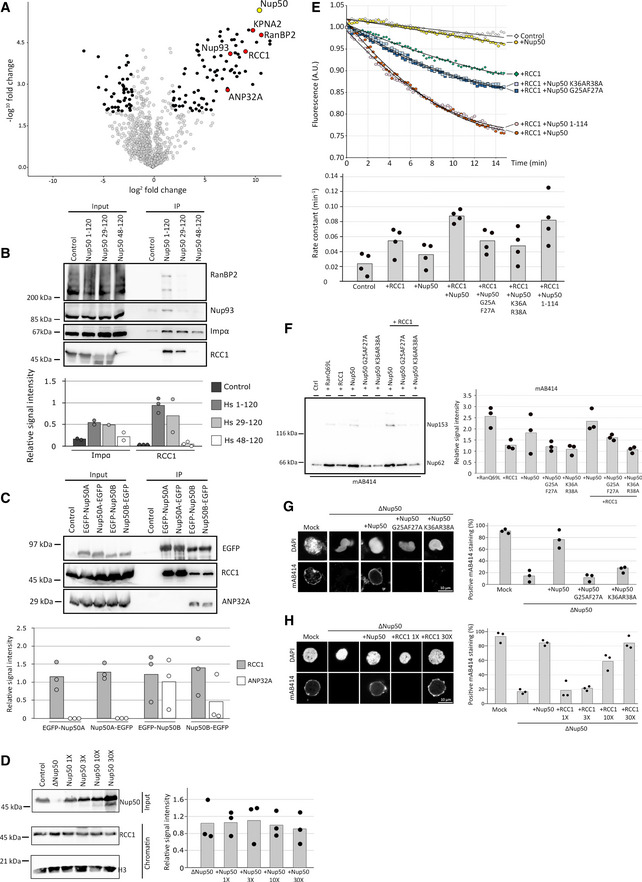
Figure 8. Nup50 stimulates RCC1 activity for NPC assembly.

-
AHEK293T cells were transfected with empty FLAG‐tag vector as a control or FLAG‐Nup50 N‐terminal fragment (aa 1–120 of the human sequence). 24 h post‐transfection, cells were lysed, FLAG‐tagged proteins were immuno‐isolated, and analyzed by mass spectrometry with the Volcano plot showing the identified interactors (four‐fold change compared with the control and P < 0.01 in black, red if confirmed by Western blotting (B), see Dataset EV2 for full list) of Nup50 (yellow, data from three independent experiments). KPNA2 is the gene name of importin α.
-
BHEK293T cells were transfected with empty FLAG‐tag vector or FLAG‐Nup50 N‐terminal fragments (aa 1–120, 29–120 and 48–120 of the human sequence), processed as in (A) and analyzed by Western blotting, with 10% of the inputs loaded. The quantification (lower panel) shows the mean signal intensity normalized on the input of at least two independent experiments. Data points from individual experiments are indicated.
-
CHEK293T cells were transfected with both Nup50 mouse orthologs N‐ and C‐terminals tagged with EGFP. 24 h post‐transfection, cells were lysed, EGFP‐tagged proteins immuno‐isolated, and analyzed by Western blotting. The quantification of the Western blot (C, lower panel) shows the mean signal intensity normalized on EGFP of three independent experiments. Data points from individual experiments are indicated.
-
DXenopus sperm chromatin (6,000 sperm heads/µl were incubated with 120 µl of control), Nup50‐depleted or egg extracts supplemented with excess (1X = 0.07 µM final) recombinant Xenopus Nup50 and re‐purified. Total input extracts were analyzed by Western blotting against Nup50, and isolated chromatins were analyzed by Western blotting against RCC1 and histone H3 as a loading control (left panel). The quantification (right panel) shows the mean signal intensity of the RCC1 signal normalized over histone H3 from three independent experiments. Data points from individual experiments are indicated.
-
E2 µM recombinant Ran, loaded with MANT‐GDP was incubated with 2 mM GppNHp in buffer control, supplemented with 2 nM recombinant RCC1, 20 nM recombinant Xenopus Nup50 proteins, or RCC1 and Nup50 together. GDP‐to‐GppNHp exchange was monitored by the decrease in MANT fluorescence of the liberated GDP‐MANT. The lower panel shows the rate constant of each experimental condition with n = 4 independent experiment per condition, bars represent the mean, and individual data points are indicated.
-
FXenopus egg extracts were supplemented with 5 µM RanQ69L, RCC1, Xenopus Nup50 wild‐type, and RCC1‐binding mutants as well as a combination of 5 µM Nup50 and 5 µM RCC1. After 90 min, annulate lamellae were isolated by centrifugation and quantified by Western blotting with mAB414 antibody. Quantitation shows the relative Nup62 signal as a mean from three independent experiments, normalized to the buffer control. Individual data points are indicated.
-
GConfocal microscopy images of nuclei assembled for 120 min in mock‐depleted, Nup50‐depleted (ΔNup50), and Nup50‐depleted Xenopus egg extracts supplemented with recombinant Xenopus wild‐type Nup50 or RCC1 binding mutants. Nuclei were fixed in 4% PFA and 0.5% glutaraldehyde, stained for NPCs (mAB414) and the chromatin (DAPI). Scale bar: 10 µm. Quantitation shows the average percentage of mAB414‐positive nuclei for 100 randomly chosen chromatin substrates in each of three independent experiments. Individual data points are indicated.
-
HConfocal microscopy images of nuclei assembled for 120 min in mock‐depleted, Nup50‐depleted (ΔNup50), and Nup50‐depleted Xenopus egg extracts supplemented with RCC1 excess as indicated. Nuclei were fixed in 4% PFA and 0.5% glutaraldehyde and stained for NPCs (mAB414) and the chromatin (DAPI). Scale bar: 10 µm. Quantitation shows the average percentage of mAB414‐positive nuclei for 100 randomly chosen chromatin substrates in each of three independent experiments. Individual data points are indicated.
Source data are available online for this figure.
