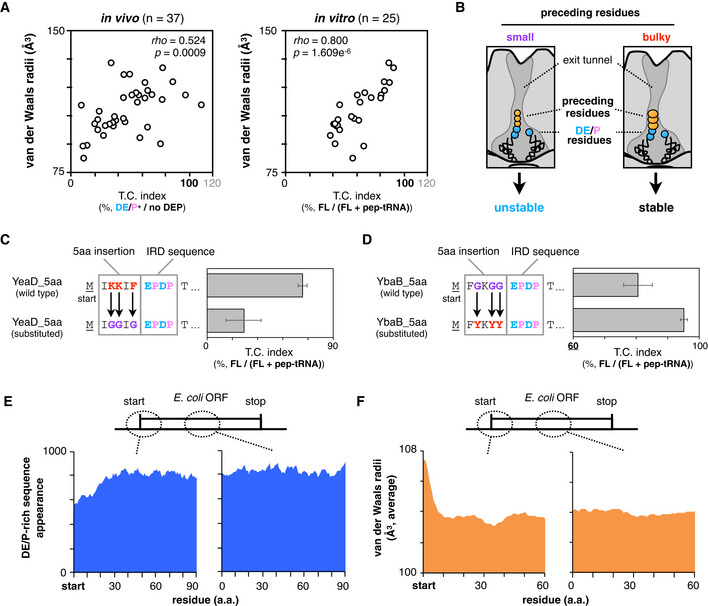
Figure 2. Genome‐wide biases in amino acids distributions and van der Waals radii.

-
ATwo‐dimensional plots of downstream translation continuation of the 5 aa‐EPDP constructs and averaged van der Waals molecular radii of inserted sequences. Both in vivo (left) and in vitro (right) experiments are represented with Spearman's rho and P‐values calculated by Spearman's rank correlation tests.
-
BSchematic of the ribosomal tunnel occupancy by the bulkiness of the nascent polypeptide adjacent to the PTC.
-
CEffect of the substitution of bulky (K and Y) residues of YeaD_5aa‐EPDP to smaller one (G) on IRD. The mean values ± SE estimated from three independent technical replicates are shown.
-
DEffect of the substitution of small (G) residues of YbaB_5aa‐EPDP to bulkier one (Y) on IRD. The mean values ± SE estimated from three independent technical replicates are shown.
-
EDistributions of the DE/P‐rich sequence (more than 3 DE/P in a 10‐residue moving window) appearance at the N‐terminal regions (left) and in the middle (right) of entire E. coli ORFs.
-
FAveraged van der Waals molecular radii of every 5‐aa window at the N‐terminal regions (left) and in the middle (right) of entire E. coli ORFs.
