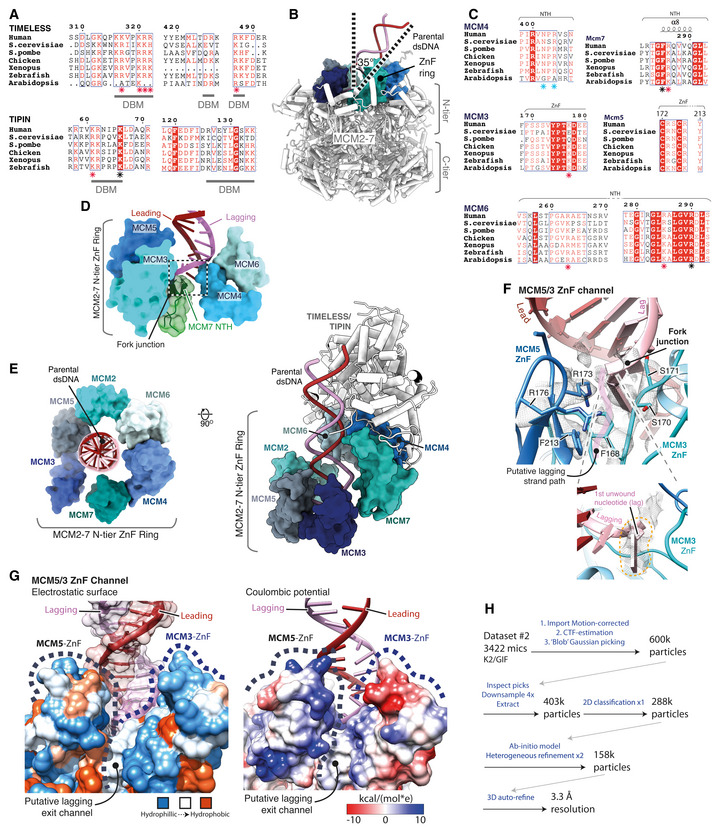
Figure EV6. (Related to Fig 7). Interactions between the human replisome and fork DNA.

- Multiple sequence alignment for regions in TIMELESS (top) and TIPIN (bottom) involved in DNA binding. Specific residues seen to be interacting with dsDNA in the structure are demarcated as part of a DNA‐binding motif (DBM). Level of conservation for residues contacting dsDNA indicated with a coloured asterisk, red—charge, blue—highly, black—invariant. All alignments in the figure were carried out using NCBI Clustal Omega and visualised using ESPrit with the primary human sequence indicated. Uniprot ID for sequences used for TIMELESS alignment: H. sapiens (Q9UNS1‐1), S. cerevisiae (P53840‐1), S. pombe (Q9UUM2‐1), G. gallus (A0A3Q2UKM8‐1), X. laevis (Q3LGB9‐1), D. rerio (E7FGL0‐1), A. thaliana (A0A1P8B9S9‐1). TIPIN alignment: H. sapiens (Q9BVW5‐1), S. cerevisiae (Q04659‐1), S. pombe (O14350‐1), G. gallus (Q5F416‐1), X. laevis (Q0IHI4‐1), D. rerio (Q6DBR4‐1).
- Side‐on view of the MCM2‐7 complex, displayed using pipes and planks, illustrating the angle of the parental dsDNA as it enters the N‐tier. The ring of ZnF domains that encircle the incoming duplex is rendered as an opaque surface.
- Multiple sequence alignment for the regions of MCM4, 6, 3, 5, 7 contacting the DNA at the fork junction as shown in (A). Level of conservation for residues contacting DNA at the fork junction indicated with a coloured asterisk, red—charge, blue—highly, black—invariant. Uniprot ID for sequences used for the MCM5 alignment is as described in Fig EV4H. Uniprot IDs used for MCM4 alignment: H. sapiens (P33991‐1), S. cerevisiae (P30665‐1), S. pombe (P29458‐1), G. gallus (E1C2U4‐1), X. laevis (P30664‐1), D. rerio (Q6NZV2‐1), A. thaliana (Q0WVF5‐1). MCM6 alignment: H. sapiens (Q14566‐1), S. cerevisiae (P53091‐1), S. pombe (P49731‐1), G. gallus (Q5ZKR8‐1), X. laevis (Q5FWY4‐1), D. rerio (A0A0E4AYA7‐1), A. thaliana (F4KAB8‐1). MCM7 alignment: H. sapiens (P33993‐1), S. cerevisiae (P38132‐1), S. pombe (O75001‐1), X. laevis (Q91876‐1), D. rerio (Q7ZVL6‐1), A. thaliana (P43299‐1). MCM3 alignment: H. sapiens (P25205‐1), S. cerevisiae (P24279‐1), S. pombe (P30666‐1), X. laevis (P49739‐1), D. rerio (A0A0E4AY38‐1), A. thaliana (Q9FL33‐1).
- MCM2‐7 N‐tier loops contacting the dsDNA at the fork junction. Model rendered as an opaque surface, with the MCM2‐7 NTH also displayed as a cartoon with transparent surface rendering.
- Two views of the MCM2‐7 N‐tier secondary ZnF domain ring, which encircles the incoming parental dsDNA duplex. The ZnF models are displayed using opaque surface rendering with TIMELESS‐TIPIN and dsDNA visualised as a cartoon using pipes and planks rendering.
- Detailed view of the putative lagging‐strand exit channel between the MCM3 and MCM5 ZnF’s (Top). Model visualised using cartoon rendering with selected side chains displayed and their corresponding cryo‐EM density represented as a transparent mesh. Focussed view highlighting the first lagging‐strand nucleotide following strand separation and its corresponding cryo‐EM density (Bottom).
- MCM5/3 ZnF channel displayed using surface rendering, coloured according to electrostatic potential (left) and Coulombic potential (right) (Pettersen et al, 2004) according to their respective inset keys.
- Schematic pipeline diagram describing the processing of 3422 micrographs from cryo‐EM collection #1 in the presence of CLASPIN using CryoSPARC (Punjani et al, 2017). This processing resulted in a reconstruction in which density was identified between the MCM5 and MCM3 ZnF’s that is continuous with the lagging strand at the fork junction.
