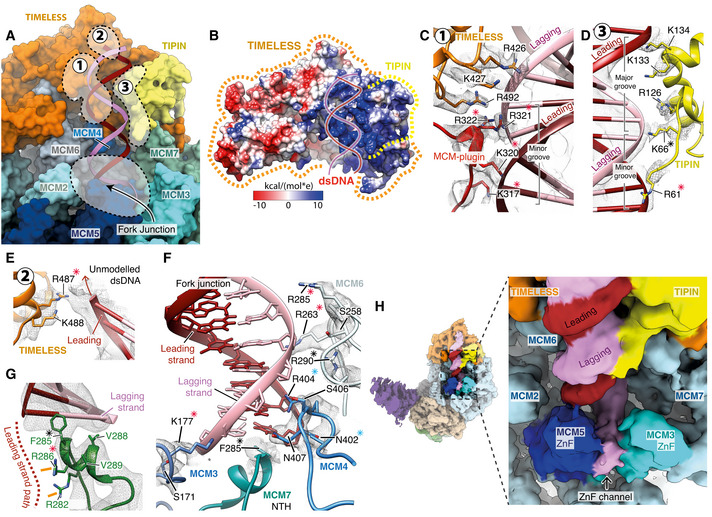
Figure 7. Coordination of replication fork DNA during template unwinding.

-
AOverview of the interactions between the MCM2‐7 N‐tier and TIMELESS‐TIPIN with the parental DNA duplex and fork junction. Key regions of protein–DNA contacts are circled with dashed lines and labelled. Surface rendering of the replisome model with DNA displayed as a cartoon.
-
BSurface rendering of TIMELESS‐TIPIN coloured by Coulombic potential (see inset key) highlighting the positively charged concave groove that accommodates the parental DNA duplex. Approximate positions of TIMELESS and TIPIN indicated using dashed lines.
-
C–EDetailed views of the contacts between TIMELESS‐TIPIN and the parental DNA duplex. Cartoon model rendering with selected side chains displayed and overlaid with their corresponding cryo‐EM density in transparent mesh. Asterisks indicate conserved residues, red—charge conserved, blue—highly conserved, black—invariant. (C) A network of positively charged residues from the TIMELESS MCM‐plugin and helical repeats 6‐7 interact with the DNA backbone across the minor groove. (D) Positively charged residues extending from the TIPIN tetra‐helical HTH contact the DNA backbone, an interface that is augmented by additional DNA contacts formed by the N‐terminal DNA‐binding motif of TIPIN. (E) Positively charged residues from helical repeat 7 of TIMELESS project towards the leading strand of the parental DNA duplex.
-
F, GDetailed view of the replisome contacts with DNA at the fork junction. Asterisks indicate conserved residues, red—charge conserved, blue—highly conserved, black—invariant. (F) Contacts between MCM3,4,6 and 7 in the N‐tier and the DNA fork junction. (G) Detailed view of the MCM7 NTH positioned against the final base of dsDNA. The likely path of the leading‐strand template following unwinding is depicted by a dashed line and two arginine residues likely to coordinate it are highlighted (orange lines).
-
H(Left) Cryo‐EM map for the core human replisome coloured according to chain occupancy using a radius of 5 Å. The cryo‐EM map was obtained using a subset of data processed in CryoSPARC (Fig EV6H). (Right) Zoomed in view of the fork junction displaying continuous density extending from the lagging‐strand template at the point of strand separation out through the MCM3/5 ZnF channel. Density in the MCM3/5 ZnF channel that we attribute to the lagging‐strand template was coloured manually in UCSF Chimera.
