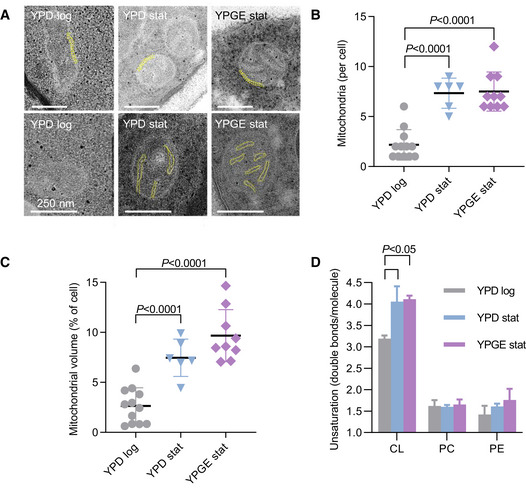
Figure EV1. Stationary growth increases the density of cristae, the abundance of mitochondria, and the unsaturation of cardiolipin (CL), but not the unsaturation of phosphatidylcholine (PC) and phosphatidylethanolamine (PE) in S. cerevisiae .

-
AThe mitochondrial ultrastructure was analyzed by transmission electron microscopy. The yellow labels show the double membrane of mitochondria (OM and boundary IM) in the upper panels and mitochondrial cristae (IM) in the lower panels. Scale bars have a length of 250 nm.
-
B, CThe number of mitochondrial cross‐sections and the mitochondrial volume were quantified in randomly collected electron micrographs. Multiple micrographs were analyzed per biological replica.
-
DLipids were analyzed by mass spectrometry and the number of double bonds per molecule was calculated from the compositions of CL, PC, and PE.
Data information: The graphs show biological replicas (N = 3), mean values, and standard deviations. Means were compared by Student’s t‐test.
