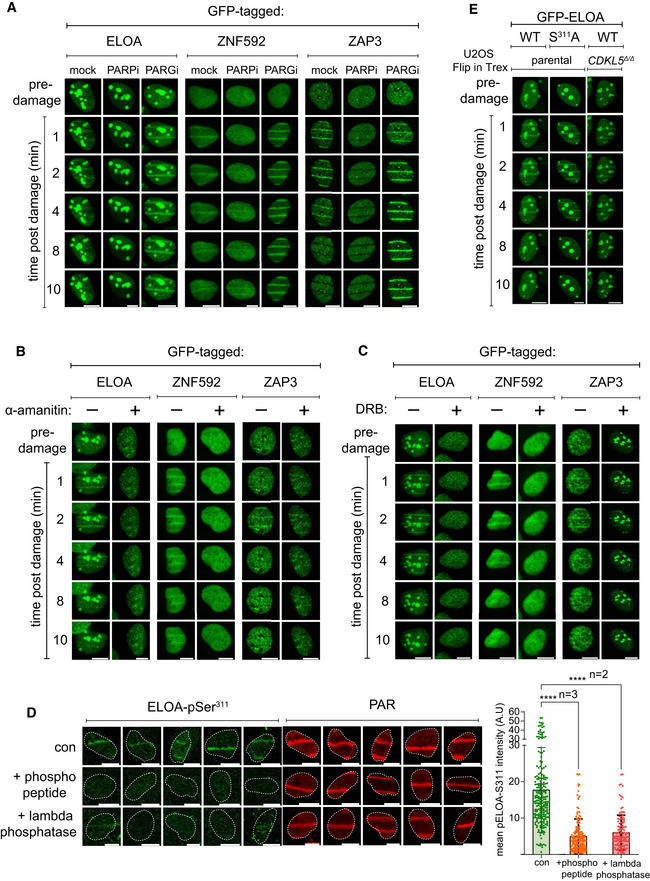
Figure EV4. Recruitment of CDKL5 substrates to DNA damage sites.

-
A–CBrdU‐sensitized U‐2‐OS (Flp‐In T‐REx) cells stably expressing GFP‐tagged forms of the proteins indicated were pre‐incubated with (A) olaparib (PARPi; 5 µM) or PD00017273 (PARGi; 0.3 µM, 1 h), (B) α‐amanitin (20 µg/ml, 8 h) or (C) DRB (100 µM, 2 h) prior to line micro‐irradiation (355 nm) and time‐lapse imaging. One of three independent experiments is shown. Scale bar is 10 μm.
-
DBrdU‐sensitized U‐2‐OS (Flp‐In T‐REx) cells were subjected to nuclear line micro‐irradiation (355 nm). Cells were fixed and then mock‐treated (con) or treated with lambda‐phosphatase prior to incubation with the primary antibodies indicated. Alternatively, ELOA‐pSer311 phosphopeptide was included during incubation with the primary antibodies before indirect immunofluorescence analysis. Quantification of ELOA‐pSer311 signal at the laser tracks is shown. Data represent mean ± SD of total pELOA Ser311 intensities in different biological replicates as indicated (n). For simplicity, only intensities greater than zero are shown. Statistical significance was assessed by one‐way ANOVA test. Asterisks **** indicate P‐values of < 0.0001. Scale bar is 10 μm.
-
EBrdU‐sensitized U‐2‐OS cells (Flp‐In T‐Rex; CDKL5–disrupted (CDKL5Δ / Δ) or parental cells) stably expressing GFP‐tagged ELOA wild‐type (WT) or S311A mutant were line‐micro‐irradiated and imaged after at the time points indicated.
Source data are available online for this figure.
