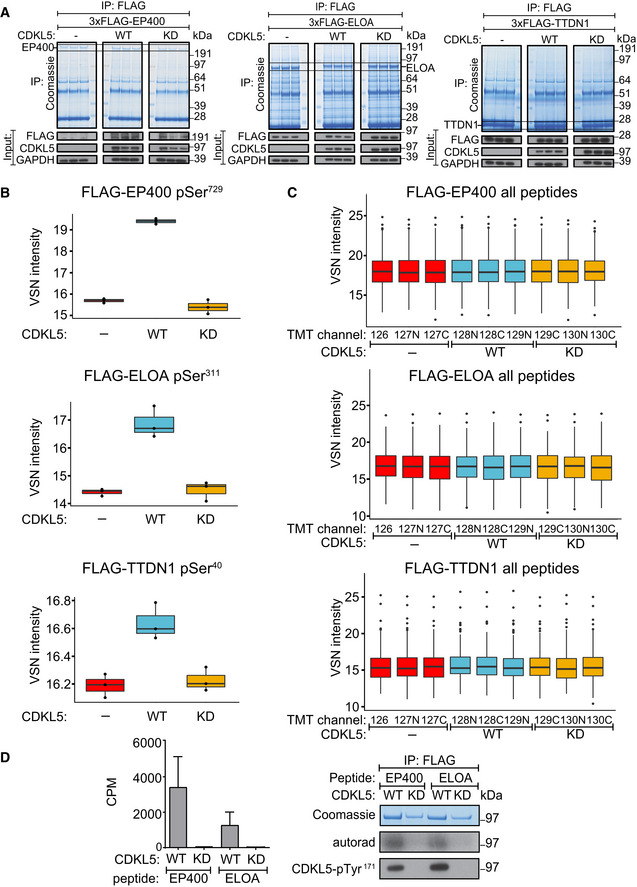
Figure 5. Validating phosphorylation of EP400, ELOA and TTDN1.

- HEK293 cells were co‐transfected with CDKL5NLS (wild‐type “WT” or kinase‐dead “KD” K42R mutant) and either FLAG‐EP400 (left), FLAG‐ELOA (middle) or FLAG‐TTDN1 (right). 24 h later, cells were incubated with H2O2 (500 µM) for 15 min before being harvested and lysed. Protein extracts were subjected to immunoprecipitation with anti‐FLAG‐agarose beads. Precipitates were subjected to SDS–PAGE and blotting with antibodies shown (bottom panels) or staining with Coomassie Brilliant Blue (top panels). The bands corresponding to the FLAG‐tagged proteins were excised from the gels in A. and processed for mass spectrometric detection of relevant phosphopeptides. Three independent co‐transfection experiments were done for every condition.
- Boxplots showing VSN‐normalized intensity of phosphopeptides corresponding to EP400‐pSer729, ELOA‐pSer311 and TTDN1‐pSer40 from the experiment in (A). The central band of the boxplot indicates the median value, while the hinges represent the first and third quartile (bottom and top of boxplot, respectively). The whiskers extend to the largest/smallest (upper or lower whisker, respectively) datapoint not further than 1.5 times the interquartile range from their respective hinge. In all cases, the data were derived from 3 biological replicates.
- Boxplots of the VSN‐adjusted TMT reporter ion intensities for all peptides for each TMT label in the case of FLAG‐EP400, FLAG‐ELOA and FLAG‐TTDN1 from the experiment in (A). The central band of the boxplot indicates the median value, while the hinges represent the first and third quartile (bottom and top of boxplot, respectively). The whiskers extend to the largest/smallest (upper or lower whisker, respectively) datapoint not further than 1.5 times the interquartile range from their respective hinge. Datapoints were further removed, and then, the whiskers are plotted individually. The experiment was conducted using three biological replicates within each respective group, and each TMT channel represents a single biological replicate.
- Left: Anti‐FLAG precipitates from HEK293 cells transiently expressing FLAG‐tagged CDKL5 (wild‐type “WT” or a K42R kinase‐dead “KD” mutant) were incubated with the synthetic peptides indicated, in the presence of [γ‐32P]‐labelled ATP‐Mg2+, and peptide phosphorylation was measured by the Cerenkov counting. Data are represented as mean ± SEM from three independent experiments. Right: Same but anti‐FLAG precipitates were subjected to SDS–PAGE and autoradiography to detect CDKL5 autophosphorylation, or Western blotting with CDKL5‐pTyr171 antibody specific for the CDKL5‐Tyr171 autophosphorylation site (Munoz et al, 2018).
Source data are available online for this figure.
