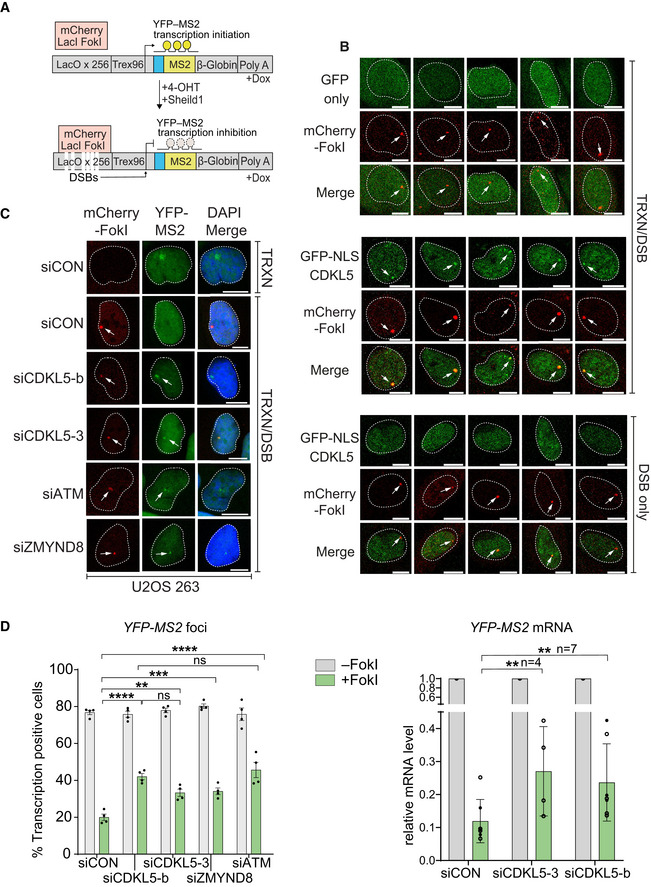
Figure 7. CDKL5 facilitates transcriptional repression at DNA breaks.

- Cartoon of reporter construct (Tang et al, 2013) in which induction of the mCherry‐tagged FokI endonuclease (with 4‐OHT) results in double‐strand break (DSB) in a region upstream of a doxycycline‐inducible reporter gene (YFP‐MS2). Ongoing transcription of the reporter gene can be visualized by the presence of a YFP‐MS2 fusion protein that binds stem–loop structures in the nascent transcript.
- CDKL5 is recruited to FokI‐induced DSBs. GFP alone (top panel) or GFP‐NLS‐CDKL5 (middle and bottom panels) was stably expressed in U‐2‐OS 265 DSB reporter cells. Cells were mock‐treated or treated with 1 µg/ml doxycycline for 3 h to induce transcription of the reporter gene. An hour before DSB induction, cells were treated with 0.3 µM PARG and 10 µM ATM inhibitor. Site‐specific DSBs were induced by treating the cells with 4‐OHT and Sheild1 ligand. Cells were live‐imaged at 37°C, between 15 and 25 min following DSB induction. Representative image showing the recruitment of GFP‐NLS‐CDKL5 to FokI‐induced DSBs upstream of transcriptionally active (middle) but not the inactive (bottom) MS2 gene. GFP alone is used a control (top). White arrowheads mark the location of the mCherry‐FokI upstream of the MS2 reporter cassette. Images are representative of multiple technical replicates of three independent experiments. Scale bar is 10 μm.
- Representative image for U–2–OS 263 IFII cells harbouring the reporter construct and transfected with the siRNAs indicated. After addition of doxycycline, transcription was monitored in cells ± induction of FokI by quantification of YFP(–MS2) foci. Arrows indicate sites of FokI‐mediated DSB (mCherry) and YFP‐MS2 transcript. “TRXN”: doxycycline added; “TRXN/DSB”: doxycycline added with 4‐OHT. Scale bar is 10 μm.
- (Left) Quantification of transcription in U‐2‐OS 263 IFII reporter cells from experiment in B. > 150 cells were analysed per condition per experiment. The mean ± SD from four independent experiments is shown. (Right) Quantitative RT–PCR analysis of YFP‐MS2 mRNA in U‐2‐OS 263 reporter cells. Data represent mean ± SD in different biological replicates as indicated (n). Statistical significance for all the data was assessed by two‐way ANOVA test, **P < 0.01, ***P < 0.001 and ****P < 0.0001; ns—not significant.
Source data are available online for this figure.
