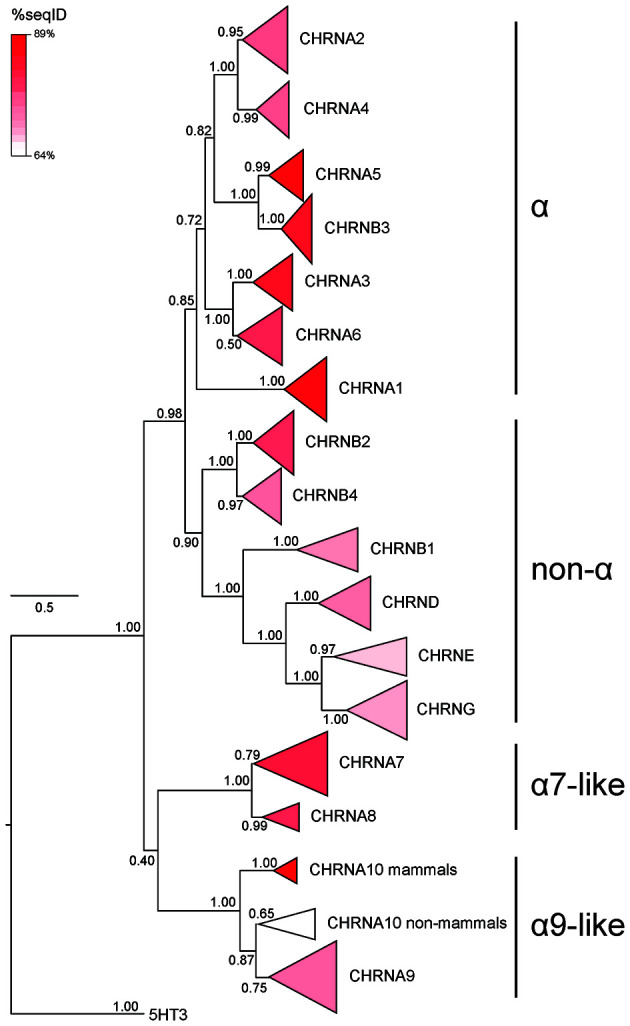
Figure 3.

Phylogenetic tree showing the relationships between vertebrate nicotinic subunits. The branches corresponding to the same subunits of different species were collapsed to their respective node. The length of each triangle denotes sequence divergence from the corresponding node. Triangle shades depict the average sequence identity within the branch. Numbers in each branch indicate bootstrap values obtained during phylogeny construction. The scale bar indicates the number of amino acid substitutions per site. Modified from Marcovich et al. (2020), under the Creative Commons license (http://creativecommons.org/licenses/by/4.0/).
