Figure 2.
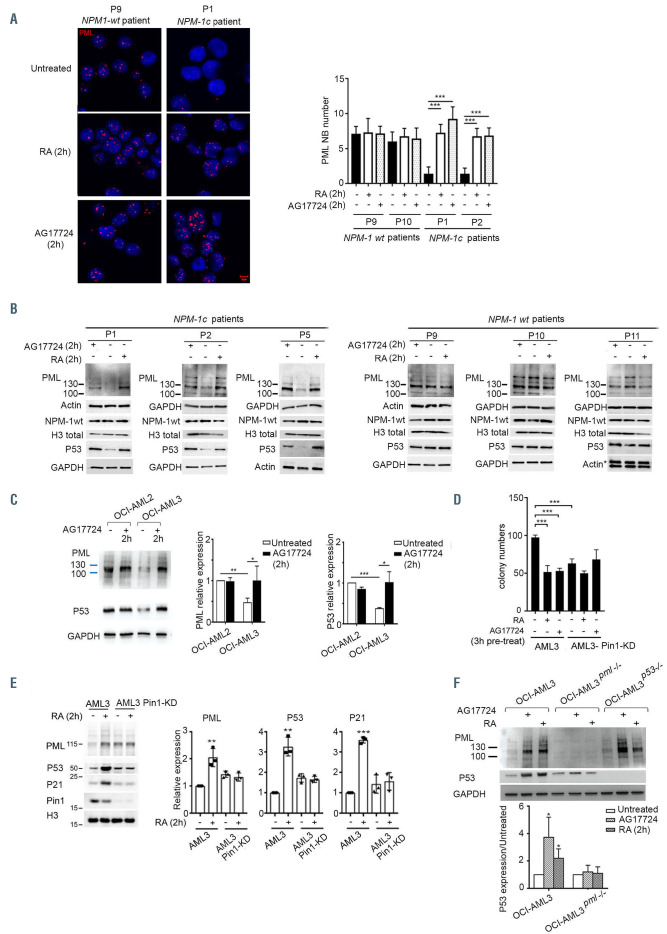
Retinoic acid targets PML/P53 through Pin1 inactivation. (A) Confocal microscopy of PML-nuclear bodies (NB) in primary blasts derived from one representative acute myeloid leukemia (AML) patient with wild-type (wt) NPM-1 and one representative AML patient with mutated NPM-1c, after ex-vivo treatment with retinoic acid (RA) or AF-17724 for 2 h as indicated. Histograms represente average number of PML NB per cell in two patients with NPM-1 wt and two patients with mutated NPM-1c. Statistical analysis was done using a Student t-test. (B) Western blot analysis of PML, P53 and total NPM-1 (NPM1-wt) in primary blasts derived from three patients with NPM-1c AML and three patients with NPM-1 wt AML, after ex-vivo treatment with 20 mM of AG17724 or 1 mM of RA for 2 h as indicated. (C) Western blot of PML and P53 in OCI-AML3 and OCI-AML2 cells following treatment with 20 mM of AG17724 for 2 h. Densitometry histograms represent an average of three independent experiments. (D) Colony-formation assays in methylcellulose of OCI-AML3, and OCI-AML3 Pin1-knock down (KD) cells, pre-treated with RA or AG17724 for 3 h (n=3). (E) Western blot analysis of PML, P53, P21, or Pin1 in OCI-AML3 and OCI-AML3 Pin1-KD after treatment with 1 mM of RA for 2 h. Densitometry histograms represent an average of three independent experiments. Densitometry was performed using ImageJ software. Statistical analysis was done using a Student t-test. (F) Western blot analysis of PML and P53 in OCI-AML3, OCI-AML3pml-/- and OCI-AML3P53-/- cells after treatment with 20 mM of AG17724 or 1 mM of RA for 2 h as indicated. Densitometry histograms represent an average of three independent experiments. Densitometry was performed using ImageJ software. Statistical analysis was done using a Student t-test, *P<0.05; **P<0.01; ***P<0.001.

