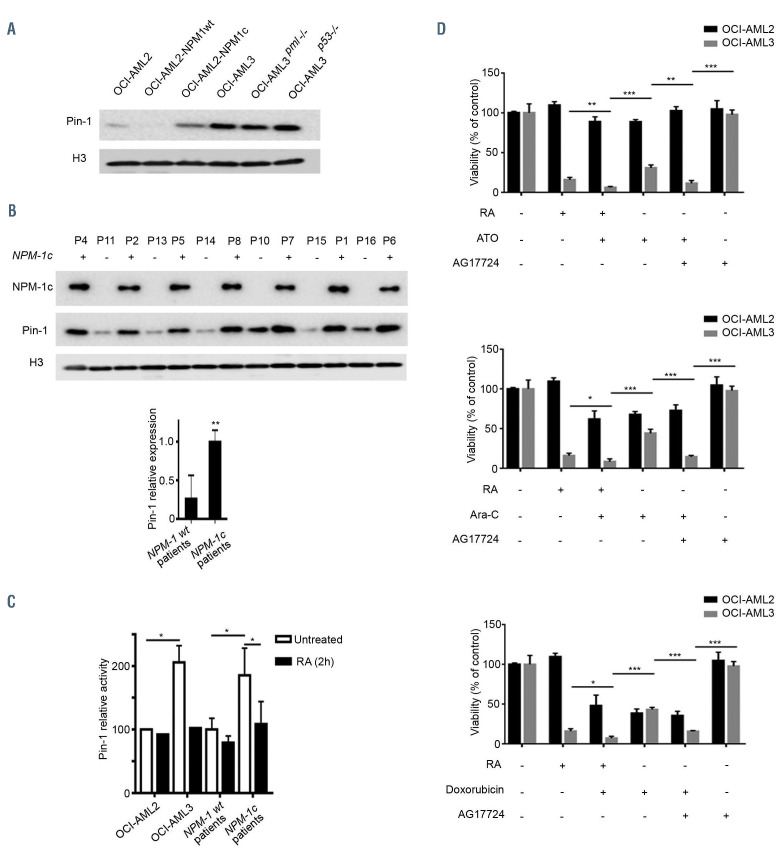
Figure 3.
NPM-1c-expressing cells exhibit high Pin1 level and activity. (A) Western blot analysis of Pin1 in OCI-AML2, OCI-AML2-NPM-1wt, OCI-AML2-NPM-1c, OCIAML3, OCI-AML3pml-/- and OCI-AML3P53-/-. (B) Western blot analysis of NPM-1c and Pin1 in primary blasts derived from seven patients with acute myeloid leukemia (AML) with NPM-1c (p4, p2, p5, p8, p7, p1 and p6) and six AML patients with wild-type NPM-1 (NPM-1 wt) (p11, p13, p14, p10, p15 and p16). Densitometry histograms represent an average of Pin1 expression level in the seven tested NPM-1c AML patients and the six tested NPM-1 wt AML patients. Densitometry was performed using ImageJ software. Statistical analysis was done using a Student t-test. (C) Pin1 relative activity in OCI-AML2, OCI-AML3 and in primary blasts derived from three NPM-1c AML patients and two NPM-1 wt AML patients after treatment with 1 mM of RA, as indicated. Statistical analysis was done using a Student t-test. (D) Cell growth (percent of control) was assessed using the trypan blue exclusion dye assay in OCI-AML2 and OCI-AML3 cells following treatment with RA alone, AG-17724 alone or their combination with arsenic trioxide (ATO), cytarabine (Ara-C) and doxorubicin for 72 h as indicated (n=3). Statistical analysis was done using a Student t-test, *P<0.05; **P<0.01; ***P<0.001.

