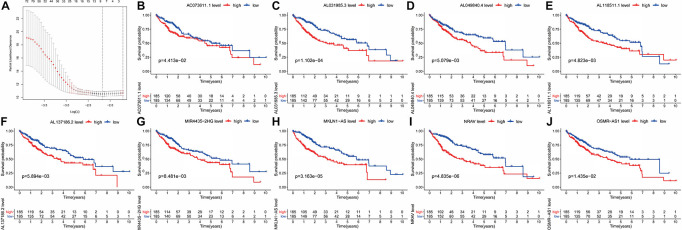
FIGURE 4.
Kaplan–Meier curve analysis of the prognostic pyroptosis-related lncRNAs in TCGA-HCC. (A) Nine differently expressed lncRNAs were selected as independent prognosis factors based on lasso regression. (B–J) The cohort was divided into two groups (high and low risk) based on the median risk score, which was used as the cutoff value, and the high expression of the nine lncRNAs indicated a bad prognosis.

