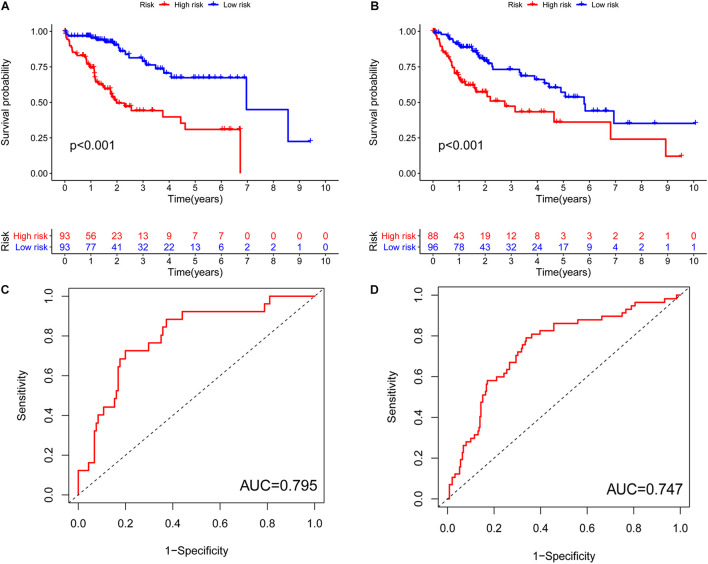
FIGURE 5.
Characteristics of the pyroptosis-related lncRNA signature in the training set and testing cohort. (A) Kaplan–Meier analysis indicated that high-risk patients had poorer survival compared with the low-risk group in the training cohort. (B) Kaplan–Meier analysis indicated that high-risk patients had poorer survival compared with the low-risk group in the testing cohort. (C) ROC curves to determine whether the expression pattern of lncRNAs related to survival can be used as an early predictor of HCC and an AUC of 0.795 in the training set. (D) An AUC 0.747 in the testing set. AUC, area under curve.

